The portal
The portal is OpenBI Server in a browser, at bi.norwayanalytics.no: everyone opens their reports there, and the server’s administrators run the server from it. This page goes through it part by part, and says who sees what.
Finding your way
Every page has the same frame:
- The rail, on the left: Home, Monitor, Workspaces (a list to pick from), Lakes and Data. A workspace and an item you have open get a place of their own below them, and so does the Admin portal while you are in it.
- Search, at the top: the whole server, as far as you may see it. See Search.
- Help (the question mark): Documentation (these pages), Connect your agent, and Copy diagnostics, which copies the server’s version, the address, whether you are its administrator, your browser and the time, for whoever helps you. The server’s version is at the foot of the menu.
- Settings (the gear). Under Your account: Password and phone (your sign-in, at OpenBI Accounts), Excel passwords, Alerts and Connected apps. A workspace’s Admins and the server’s administrators also get Data: Data sources and Manage gateways. Server administrators also get Administration: Admin portal, Users, Lakes, Gateways, Cluster, Audit log and Server and license.
- Your initials, top right: the same pages of your own, and Sign out.
Home
Home greets you by name and shows what you have under the domain you opened the server at.
- Get started: tiles for what people do next. Those who may publish somewhere get Get OpenBI Studio and Publish here (the three steps from OpenBI Studio, with this server’s address to copy). Everyone gets Connect Excel (your Excel passwords), Lakes, Data, Monitor and Connect your agent. Server administrators also get New workspace.
- Quick access: three tabs, Recent items, Favourites and Workspaces (your role in each, and its description).
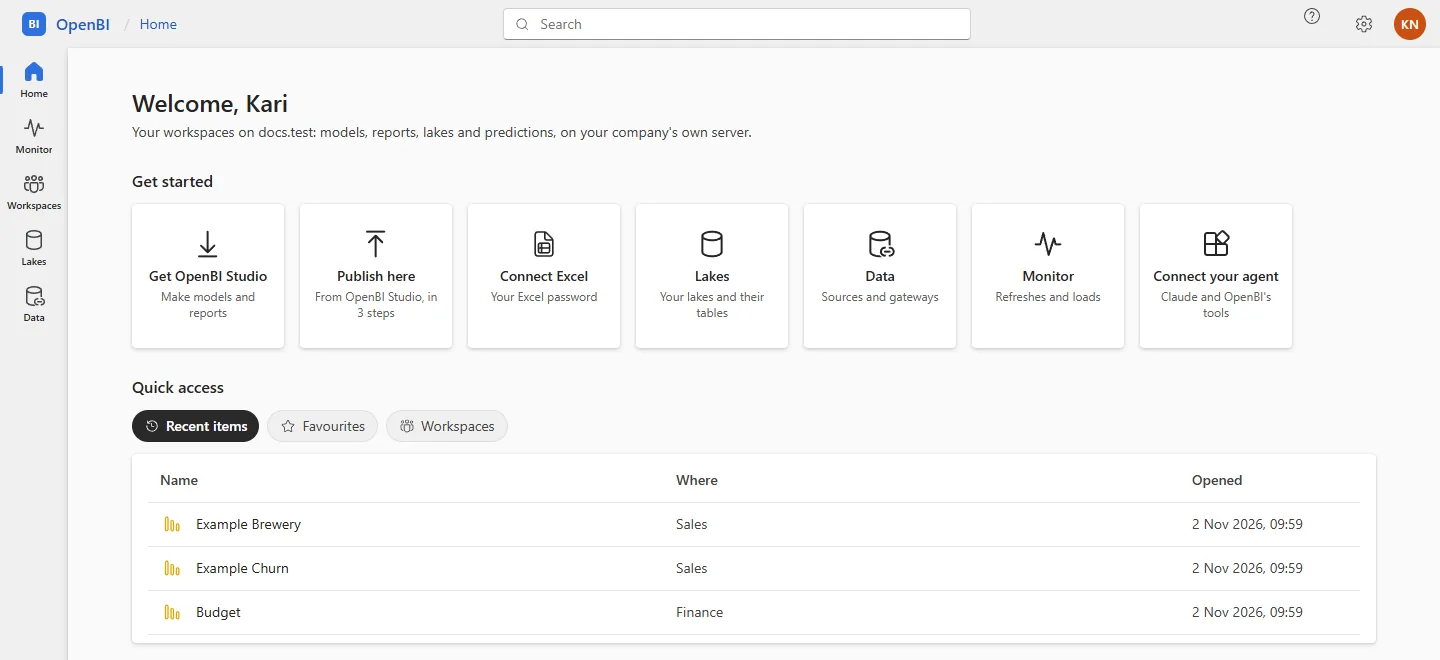
Someone with no workspace yet is told how they get one: a server administrator creates it, and anyone else sees it here once they are given access. Someone whose workspaces are under another of the server’s domains gets a link straight there.
Recent items and favourites
- Recent items: the reports you opened, the newest first, each once (the last ten).
- Favourites: what you starred. The star (☆) is beside the name at the top of a workspace’s page, an item’s What’s inside and a lake’s page, and on each row of Home’s Workspaces. Starred, it turns yellow; select it again to take it away.
- Both list only what you may still open: an archived item, or a workspace you are no longer in, drops out by itself.
Home opens on Recent items when you have opened something, else on Favourites, else on Workspaces.
Search
The search box at the top searches the whole server, as far as you may see it: workspaces (by their name or description), models, report pages and lakes. Up to eight matches show as you type, each with where it is. Enter, or Every result for “…”, opens all of them on one page, each as a Workspace, Model and report, Report page or Lake.
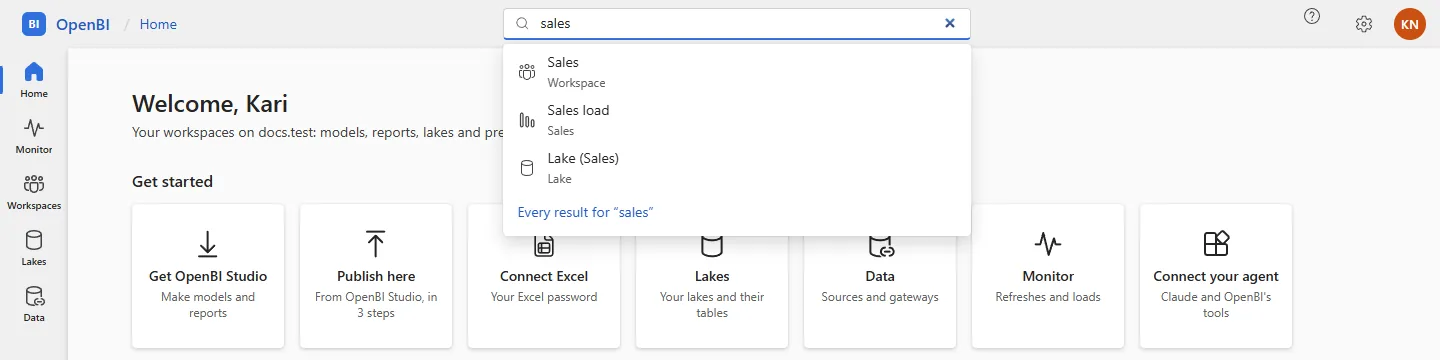
- Every word you type must be in the name; names that start with the first word come first.
- It searches names, not what is inside a report or its data.
- A hidden report page shows only to those who may publish to its workspace (Contributors and up), and a lake only to those who may use it (see Lakes).
A workspace’s page
Each item published to the workspace is a row: Name, Type, Published by, Version, Published, Refreshed (a failed refresh in red: point at it to read why) and Next refresh. Under each item, What’s inside sums up what it holds, a link for each kind: its predictions, notebooks, lake loads, security roles and queries. For its Contributors, Members and Admins, the workspace’s lakes are rows of the list too.
- At the top: Connect, for everyone (see Connect); Manage access and Workspace settings, for its Admins (see Workspaces and roles).
- Beside Filter by keyword, two buttons switch between List view and Lineage view (see Lineage).
- Each item’s … menu: Open, What’s inside, Analyze in Excel and Versions; for those whose role allows them, Settings, Refresh now, Refresh history, Download and Archive item. Who may do what says whose role allows which.
- A workspace with nothing published yet shows those who may publish to it the three steps to its first model.
What an item holds
What’s inside, under an item’s row or in its … menu, shows what the published project holds, read from its current version: how many of each on top, then each in turn. It is read only: models, reports, predictions and notebooks are made in OpenBI Studio.
- Report pages: a card each, which opens it.
- Predictions: each with its question, its kind, its headline figure (AUC, concordance, R² and so on), OpenBI Studio’s verdict, and its version’s status. A prediction’s own page has each version as OpenBI Studio kept it: its figures, what it learned from most, its charts (Kaplan-Meier curves among them), its history and the notebook run that made it. One not trained yet says so.
- Notebooks: prediction, operations research, quantitative and network notebooks, shown cell by cell with the outputs their last run kept, or as code only when it kept none.
- Lake loads: each with the lakes it writes. Their runs are in the model’s Settings.
- Security roles: their names; for the workspace’s Admins, each table’s filter, the hidden tables and columns, and the role’s members in the model.
- Queries: the model’s M and DuckDB SQL, each with its source and whether it loads, with a filter of their own.
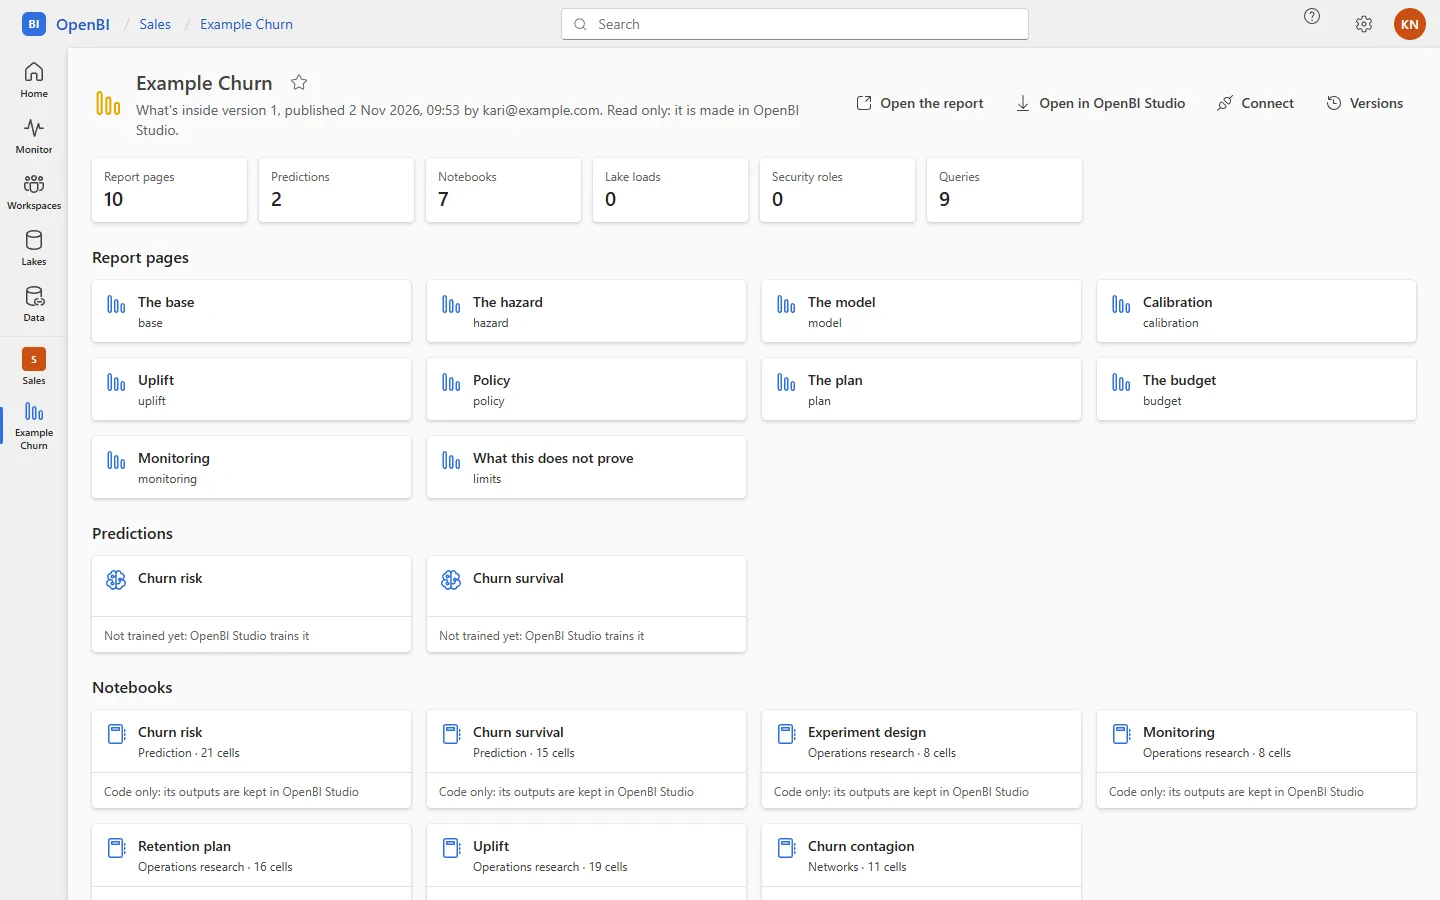
At the top: Open the report; Open in OpenBI Studio, for Contributors and up, which downloads this version to open in the studio; Connect and Versions. An older version’s contents open, read only, with ?version=<n> after the address.
Who sees what
| What | Who |
|---|---|
| Report pages, and the security roles’ names | Everyone in the workspace |
| Hidden report pages, predictions, notebooks, lake loads and queries | Contributors, Members and Admins |
| The roles’ filters, hidden tables and columns, and members | Admins, and the server’s administrators |
A Viewer is told what else there is and who sees it. The links under an item on the workspace’s page follow the same rule, as do Search and Lineage.
Lineage
Lineage view, at the right of a workspace’s list, draws where each model’s data comes from and what is made on it, from every item’s current version, in five columns: Data sources, Queries, Lake tables, Models and Report pages. Lake loads come with the lake tables they write, and models with the lake tables they read.
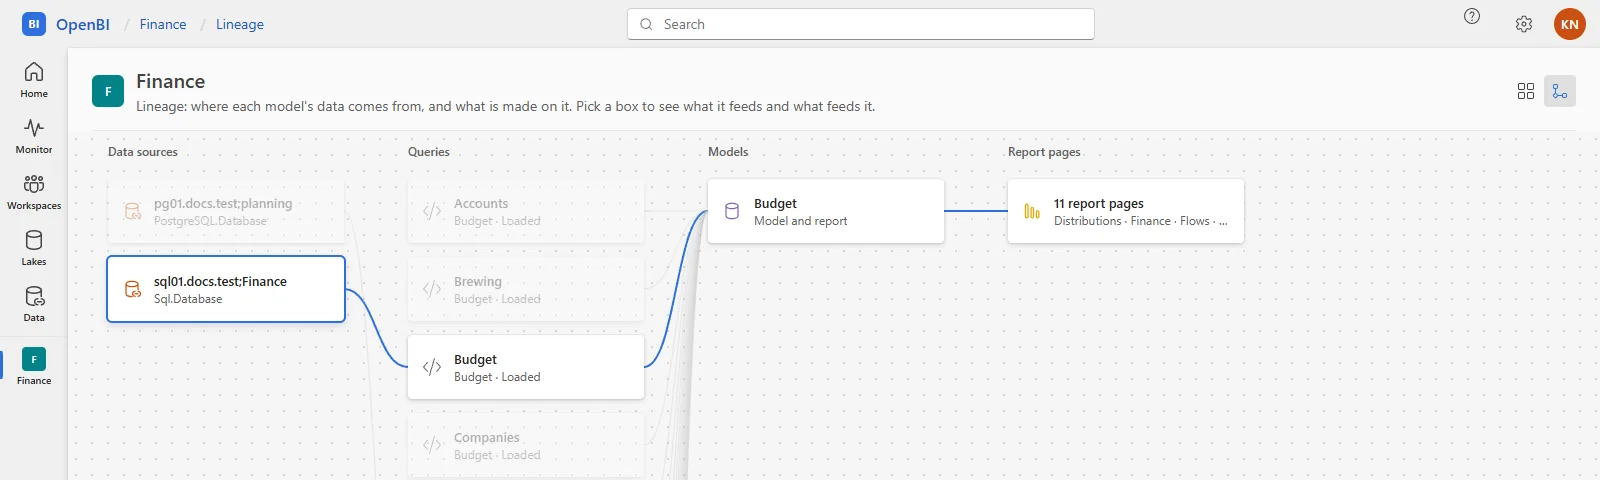
- Select a box to see what it feeds and what feeds it; everything else fades. Pick a data source, and you see what fails with it.
- A model, a query or the report pages open where they are: the item’s What’s inside, its queries, or the report.
- It is OpenBI Studio’s Query dependencies, drawn for a whole workspace.
- A Viewer sees the models and report pages only, and is told so: the sources, queries and lakes show to Contributors, Members and Admins.
Lakes
Lakes, in the rail, lists the lakes your workspaces may use: each workspace’s own lake and the shared lakes granted to it, with what you may do through them (Read and write or Read), their tables and their size. What a lake is, and how it is set up: Lakes and lake backups.
- Lakes are for a workspace’s Contributors, Members and Admins. A Viewer has none: a lake has no row-level security, so Viewers see its data only through the reports made on it.
- Server administrators see every lake on the server, with Manage in the admin portal. A lake’s rows show to them only when they are in a workspace that may read it.
- A workspace’s Admins can remove its own lake: on the workspace’s page, the lake’s … menu, Remove…. Its catalog and files stay where they are (see Removing a workspace’s lake).
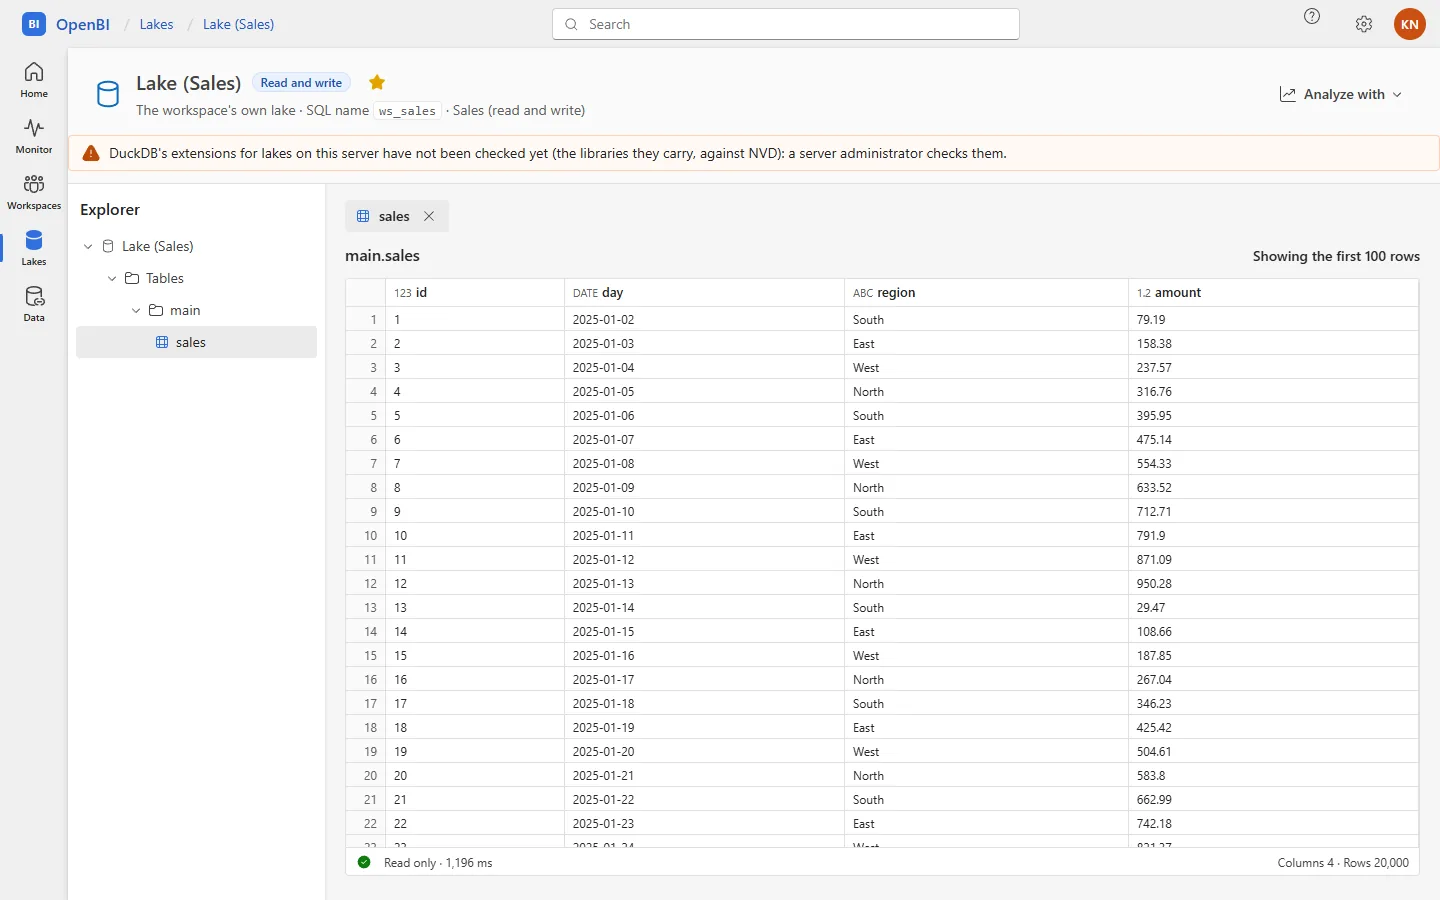
A lake’s page
- Explorer, on the left: the lake, its schemas and its tables.
- The overview: Tables, Rows, Size, Versions and Last load; then the lake’s Versions (each load makes one; those a kept refresh reads are marked Kept), its Loads, its Backups, and who uses it (Used by).
- A table: its first 100 rows, read only, with each column’s type. Each look is in the audit log, once an hour per person and table.
- Analyze with: OpenBI Studio (the M to paste in Get data › Blank query), Copy its SQL name, and Excel on each of your models that reads the lake.
- Backups, for the server’s administrators and the Admins of a workspace that writes the lake (see Back up in the portal); Lake settings, for the server’s administrators.
- When lakes can’t run on this server, a bar at the top says why: they aren’t set up yet, an extension is refused, or the extensions haven’t been checked yet. See the extension gate.
Data
Data, in the rail, is for those who look after models: a workspace’s Members and Admins, and the server’s administrators.
- Data sources: every data source of the models you look after, in one list, with its Name, Kind, Model, how the server signs in to it (Signs in with), its Status (Connected, Failed, Not set or Set) and its Last test. Select one to set its credentials in its model’s Settings: see Data sources and credentials.
- Gateways: the gateways you may see, with Manage gateways; see The OpenBI Gateway. It shows to a workspace’s Admins, the server’s administrators, and anyone who may see a gateway.
- A model’s sources show once it has been published and its settings opened, or once it has refreshed. Someone who looks after no model is told who does.
Connect
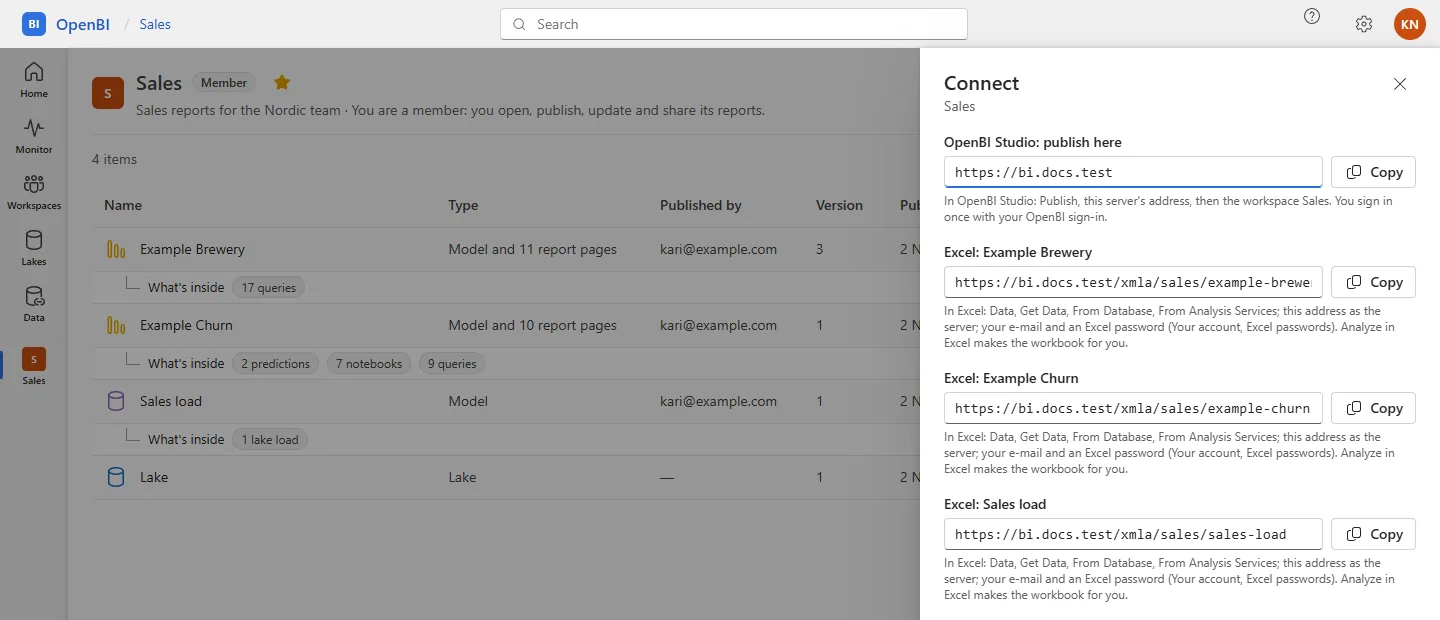
Connect, on a workspace’s page and on an item’s What’s inside, gives the addresses your tools connect to, each with Copy and how to use it:
- OpenBI Studio: publish here is the server’s own address, https://bi.norwayanalytics.no, for those who may publish to the workspace (Contributors and up). In OpenBI Studio: Publish, this address, then the workspace. See Publishing.
- Excel: <model> is a model’s address for Excel,
https://bi.norwayanalytics.no/xmla/<workspace>/<item>, for everyone in the workspace. In Excel: Data, Get Data, From Database, From Analysis Services, this address as the server, then your e-mail and an Excel password. Analyze in Excel makes the workbook for you: see Excel connections.
The address for AI agents is not here: when the server’s administrators have turned AI agents on, the help menu’s Connect your agent gives it, with Copy, and so does Settings, Connected apps. While agents are off, Connect your agent says so. See AI agents on the server.
For server administrators
The Admin portal (Settings, Administration) is for the server’s administrators only: anyone else who opens one of its pages gets “Not found”. Its sections:
- Overview and Billing: the seats in use and the plan, and with a seat licence, the seats, the plan, the card, the domain and the invoices. See Billing and Seats.
- Workspaces and Users: every workspace of every domain, and the people of OpenBI Accounts, with Import people (see Import people from a file). See Server administrators and Sign-in and OpenBI Accounts.
- Lakes: see Lakes and lake backups.
- Gateways and Cluster: see below.
- AI agents: see AI agents on the server.
- Access at a glance and Server health: below.
- Audit log: see The audit log. Server: Images from addresses (see Security), Clickable links in PDFs (see Links in a PDF), the licensed domains and the server’s own settings (see The licence).
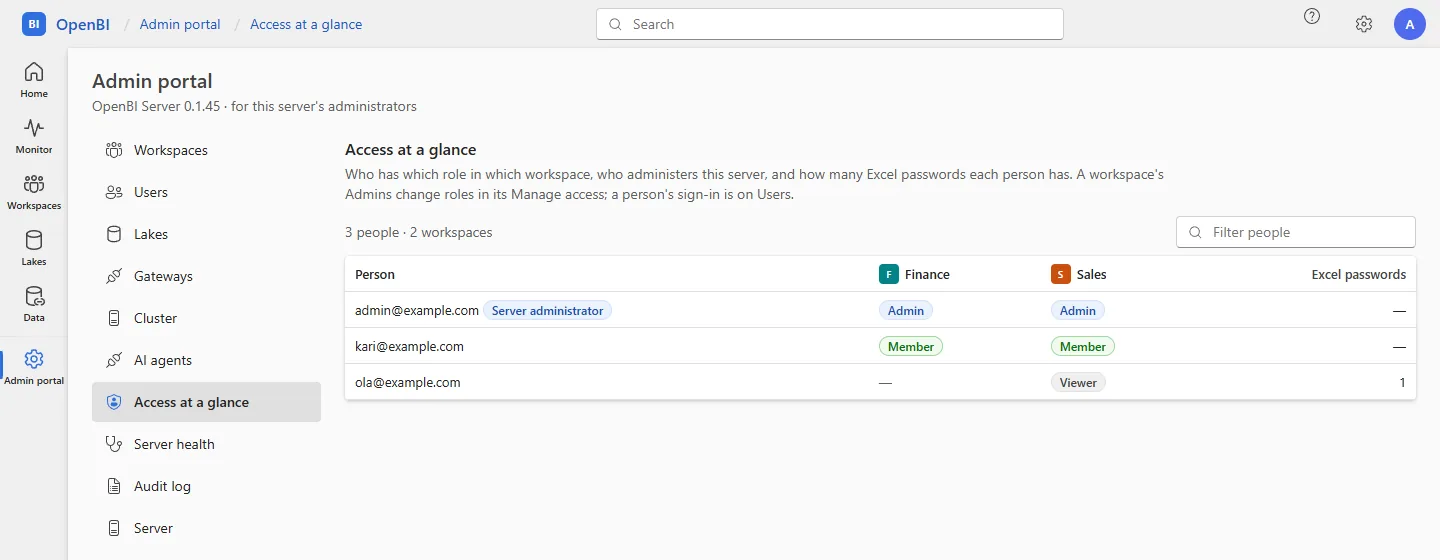
Access at a glance
Everyone who is in a workspace, and every server administrator, against every workspace of every domain: each person’s role in each (Admin, Member, Contributor or Viewer), who is a Server administrator, and how many Excel passwords each has. Filter people narrows the list; a workspace’s name opens it. It is read only: roles change in the workspace’s Manage access, and a person’s sign-in under Users.
Server health
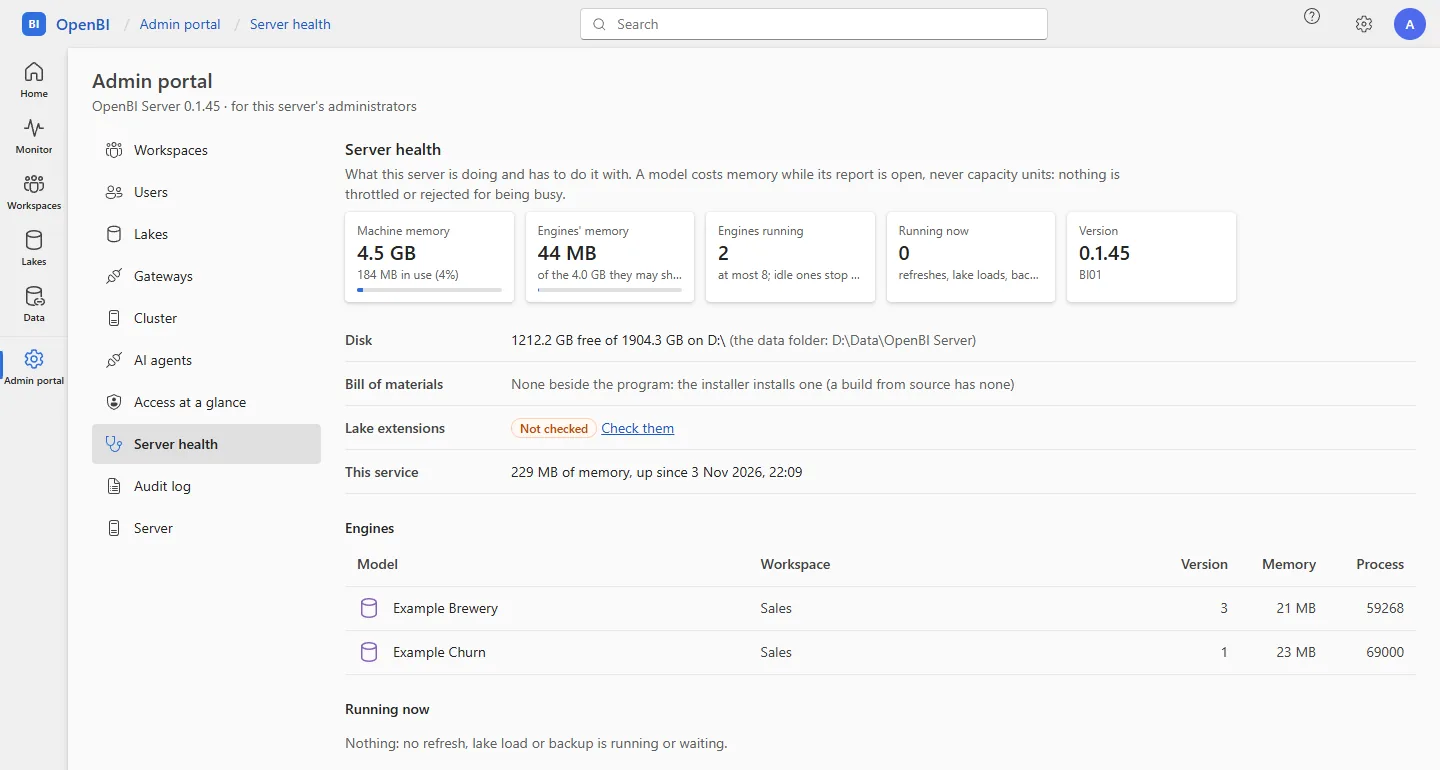
What the server is doing, and what it has to do it with:
- Machine memory; Engines’ memory, against what they may share (
Engine:TotalMemoryMB); Engines running, with how many may run and when an idle one stops; Running now, the refreshes, lake loads and backups; and Version, with the machine’s name. - Disk (the free space where the data folder is), Bill of materials (its components and what its check found, an accepted finding named as accepted: see Accepted findings), Lake extensions (their last check) and This service (its memory, and since when it runs).
- Engines: each running engine’s model, workspace, version, memory and process. Running now: each refresh, lake load or backup running or waiting, and who started it.
A model costs memory only while its report is in use; nothing is throttled or refused for being busy. The engines’ limits are on Monitor and the activity log.
Gateways and Cluster
- Gateways: server administrators manage every gateway here; their Manage gateways opens it too. A new gateway, or a computer added to one, shows the command that registers it, for Windows or a Mac, with its one-time code: the code works once, for 15 minutes, and is shown only then. A workspace’s Admins, and anyone else who may see a gateway, find them under the rail’s Data, Manage gateways. See Create the gateway on your server.
- Cluster: read only. A server alone says so; a cluster lists its nodes, each with its Machine, Version, State (Ready, Draining or Not ready), which one Holds the jobs, and its Last heartbeat. Nodes are drained and resumed from the command line: see A cluster of servers.
Frequently asked questions
Why don’t I see a lake, a prediction or a notebook?
As a Viewer, you see a workspace’s reports and the names of its models’ security roles. Its lakes, predictions, notebooks and queries are for its Contributors, Members and Admins: ask one of its Admins if your work needs them.
Can I change a notebook or a prediction in the browser?
No: the portal shows them read only. Open in OpenBI Studio downloads that version; change it in the studio, then publish it again as a new version.
Does search look inside reports and data?
No. It finds workspaces, models, report pages and lakes by their names, and workspaces by their description too.
Who sees my favourites?
Only you. Your recent items come from the server’s audit log, which its administrators read.