Reports in the browser
Everyone in a workspace opens its reports in their browser, each seeing what the model’s roles give them. Contributors and up also edit report pages there. This page covers the report view, what each role sees, editing, and how OpenBI keeps a report’s page apart from the portal.
Open a report
From Home or the Workspaces flyout, open a workspace, then an item with report pages; or straight from Home’s Recent items and Favourites, or the search box at the top (see The portal). Its address is /w/<workspace>/<item>, and a page of it /w/<workspace>/<item>/p/<page>, so a link to a page can be shared with anyone in the workspace. An item without report pages is a model only; its page lists its versions.
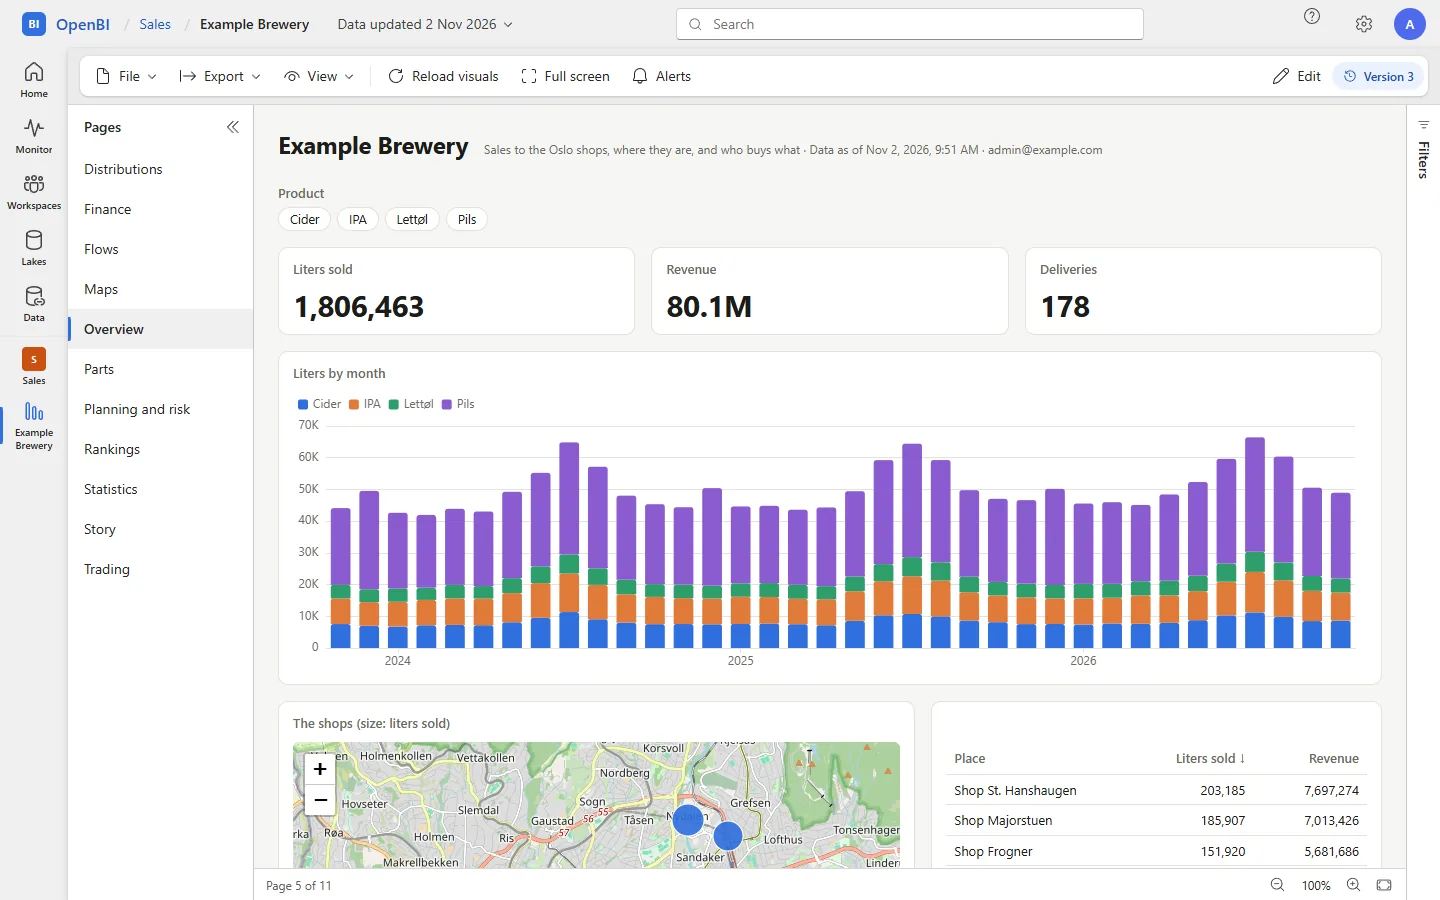
The report view
- Data updated, beside the report’s name: when its data is from. Its menu shows where the report is, its version, who published it and when, and whom to ask (the workspace’s contacts). A live model reads Live connection instead.
- File: Download this version (Contributors and up) and Versions.
- Export: Analyze in Excel (see Excel connections), and PDF of this page or of every page.
- View: Fit to page, Fit to width, Actual size; the zoom is also at the bottom right.
- Reload visuals runs the visuals’ queries again; Full screen; Alerts e-mails you when a card’s value crosses a threshold (see Alerts).
- Pages, on the left, collapsible; Filters, on the right: the page’s filters, the report’s, and the selections made on the page, each cleared from there.
- Edit, for Contributors and up: see Edit pages in the browser.
The version shown is always said. An older version opens read only, at /w/<workspace>/<item>/v/<n>, marked as such, with Open the current version: for an audit, it shows what the report showed then.
New in 0.1.43 Viewers see the current version only. Older versions are for the workspace’s Contributors, Members and Admins and the server’s administrators: each older version keeps its own roles as they were when it was published, which may have shown more. A Viewer who opens an older version’s address is told so, with Open the current version, and the versions list gives them no way to open one. A Viewer whose report is open when a newer version is published is asked to reload: “A newer version was published”, with Reload. Excel reads the current version, as before.
Links in a PDF
New in 0.1.46 A report’s PDF keeps its pages’ links clickable, each over its words: links to other sites (http and https), e-mail addresses (mailto), phone numbers (tel) and this server’s own pages. A link to another page of the report becomes that page’s address on the server, /w/<workspace>/<item>/p/<page>, where whoever opens it signs in as usual. The PDF never carries a link that runs a script or opens a file, nor a user name and password written into an address, nor an address longer than 2,000 characters: those keep their words only. The server applies this rule itself to every PDF it makes, whatever a page sends it.
A server administrator can turn the links off: Admin portal › Server › Clickable links in PDFs, on by default, or on the command line:
OpenBI.Server.exe pdf links offOff, a report’s PDF has its pages’ words and no links of any kind. A cluster’s servers share the setting, each change is in the audit log, and PDFs made before a change keep what they had.
Opening a report is in the audit log, once an hour per person and report, and so is each PDF export.
What each person sees
| Who | Sees |
|---|---|
| Contributors, Members, Admins, server administrators | All of the model’s data, and its formulas. |
| Viewers | The rows (and columns) the model’s roles give them, and no formulas. A model with roles shows someone in none of them nothing, and says why. A model without roles shows everyone all of it. |
The model’s roles come with the model from OpenBI Studio: see Row-level security. Excel shows each person the same as their reports do.
Viewers and formulas
New in 0.1.42 As in the Power BI service, a workspace’s Viewers no longer receive the model’s formulas:
- In the browser, the model a Viewer’s report reads comes without its OAX: no measure’s, calculated column’s or calculated table’s formula. Names, formats, display folders, sort-by columns and relationships come as they are, so their reports draw the same.
- In Excel, a Viewer’s field list has the measures without their OAX.
- The measures still answer. They run on the server, and every number a Viewer sees is the same as before.
- Contributors, Members, Admins and server administrators, who publish the model, get the formulas as before.
A Viewer can’t ask for the formulas back: what they receive is the server’s to decide, not the page’s. New in 0.1.43 The workspace’s Admins can give a Viewer Can see formulas, as Power BI’s Build permission does (see Can see formulas): the model their report pages read then carries its formulas, and so does what their AI agents read.
Live models
A model that is a live connection to Analysis Services or the Power BI service asks that server as people open the report. Answers are kept 24 hours per person; Reload visuals asks the server again. Which Viewers see it, and as whom, is the model’s setting: see Live connections.
Edit pages in the browser
A workspace’s Contributors, Members and Admins, and server administrators, edit its report pages in the browser, as in the Power BI service’s Editing mode. Edit in the report’s toolbar opens the editor. A Viewer has no Edit, and the editor’s address tells them “You view this report”.
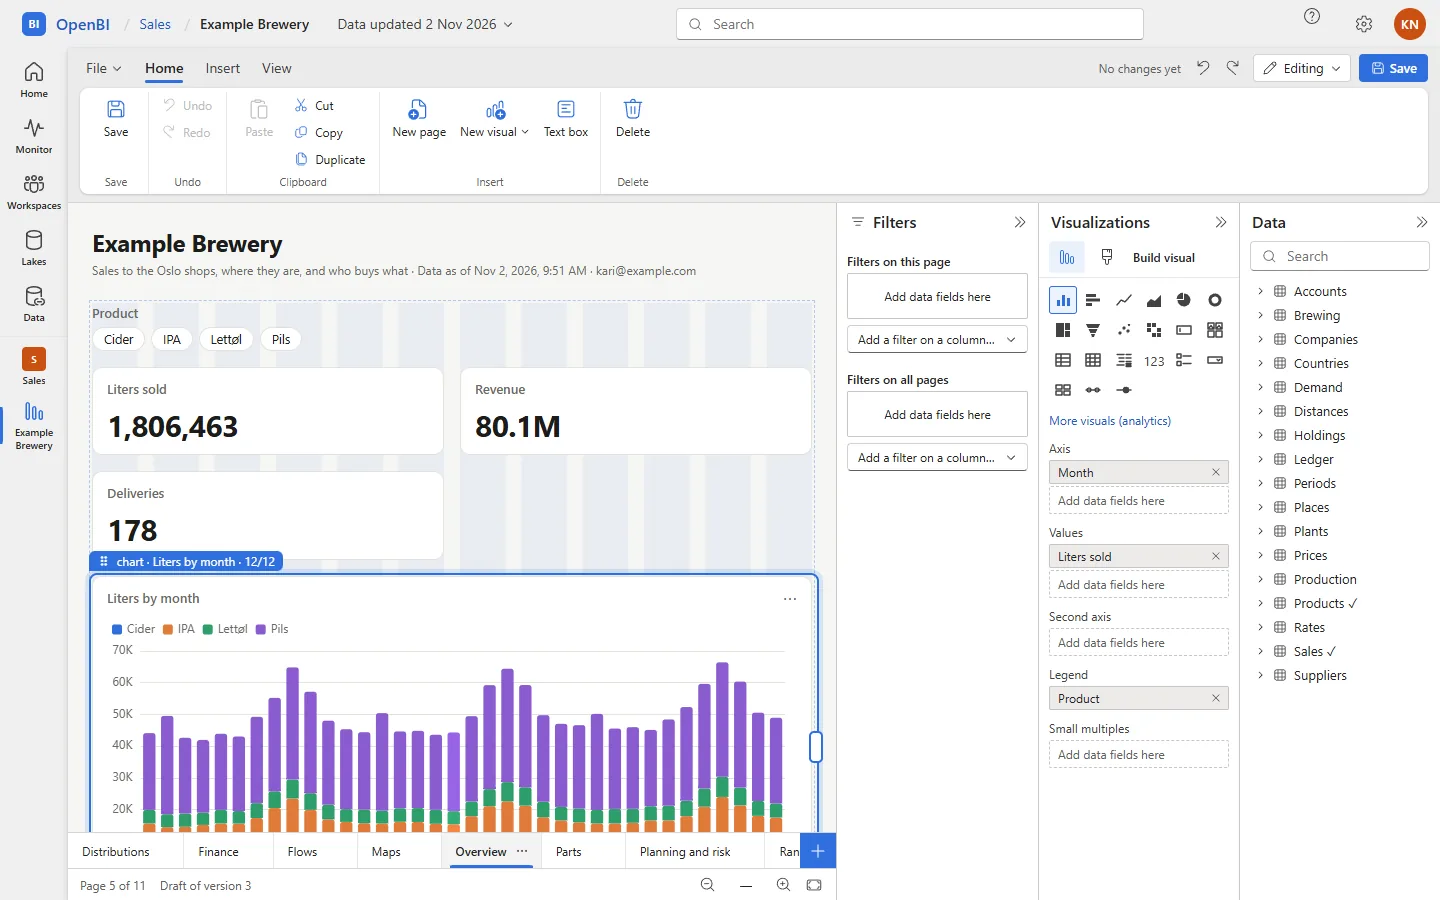
- The mode switcher, top right: Editing (make any changes) or Viewing (see your pages as people will).
- The ribbon: File (save, discard, download the version the draft began from, versions, close editing), Home (undo and redo, paste, cut, copy, duplicate, new page, new visual, text box, delete), Insert (the visuals, More visuals, text box) and View (fit and zoom, gridlines, snap to grid, lock objects, the panes).
- The page: OpenBI Studio’s own designer. Click to select a visual, drag to move it, its handles size it. The browser’s editor works on one visual at a time: selecting several, and copying pages between projects, are OpenBI Studio’s (see Several visuals at once).
- The pages bar at the bottom: + adds a page; a tab’s menu renames, duplicates, moves and deletes it; drag tabs to reorder.
- The panes: Filters (this visual’s, this page’s and all pages’; a card’s eraser, Clear filter, keeps it with nothing chosen, at “is (All)”, and its ×, Remove filter, takes it out), Visualizations (build: the gallery and the visual’s fields; format: title, size, position and its settings; the page’s name, size and background) and Data (the model’s tables, measures and columns, in their display folders).
Your draft
- Edit starts a draft, yours only, from the current version. Every change is kept on the server as you make it: a reload, another tab, another day or a restart of the server goes on where you were, undo and redo included.
- The report view says you have a draft, with Continue editing and Discard.
- A link to the editor from elsewhere, or a typed address, shows Start editing first: following a link starts nothing.
- Limits: 10 drafts open per person, 32 MB each, the last 100 changes to undo. A draft unused for 30 days is removed, and the editor says so.
Save or discard
Save makes the item’s next version, as a publish from OpenBI Studio does, with the message “Edited in the browser by <name>” and your note. It is your pages on the current version’s model and data: editing pages never changes a model or its data. The version before is kept, as every version is. Discard changes drops the draft; the report stays as its version has it.
If someone published or saved a newer version while you edited, the editor says so, and Save asks first: your pages go on the newer version’s model, and a visual that uses something renamed or removed since may need fixing. Nothing is merged silently; you may discard and edit again from the newer version instead.
Not editable in the browser yet
Measures, calculated columns and the model itself (that is OpenBI Studio’s work), a page’s HTML and CSS as text, themes, bookmarks, edit interactions, alignment and grouping, and the mobile layout.
How pages are kept apart
A report page is HTML its author made, so OpenBI keeps it apart from the portal and from the person’s sign-in:
- A sandboxed frame, with an origin of its own, so a page’s scripts never act as the person on the portal and never see their cookies.
- A pass instead of a cookie: the frame’s requests carry a pass sealed by the server, for one person, one item and one version, valid 12 hours. Every request checks the pass and the person’s access again: someone taken out of the workspace is refused within 30 seconds.
- Only what a report needs gets through: its pages and their files, the report runtime, pictures and map tiles, and the model’s queries. Anything else is refused, by the server and by the engine.
- The engine reads no data source while people view: it answers from the version’s newest data. It runs no Python or R.
- Editing uses a frame of its own, with a pass that ends when you sign out, and the server checks every change it is sent: no scripts, event handlers, frames or addresses that run code.
The first open, and engines
The first person to open a version starts an engine for it, which loads its model; that can take a moment for a large model. The engine then answers everyone’s queries for that version, and stops after 30 minutes unused. At most eight run at once, the least recently used stopping first. IT can keep models loaded for the working day: OpenBI.Server.exe engine limits --idle-time 10h, then service restart.
Data an older OpenBI computed
Data computed by OpenBI Studio 0.3.0 to 0.3.67 with a few M functions those versions got wrong (Date.StartOfMonth, Number.RoundUp and some others) is flagged on the model’s settings page, for its Admins and Members, with what to do. See Data computed by an older OpenBI.
Frequently asked questions
The report says it was published without its data
Its developer published the model without its data. A Member sets the data sources’ credentials and refreshes it: see Refresh and schedules.
A Viewer sees no rows at all
The model has roles and they are in none of them. The report says so. See Row-level security.
Do pages edited in the browser get back to OpenBI Studio?
Yes: the studio sees the newer version and offers Pull pages. See Pages edited on the server.