Reports
A report page is an HTML file in the project’s reports folder, with visuals bound to the model by name. You build it in the Report view as you would in Power BI: drag fields onto visuals, move and size them on a canvas, filter, theme it. The same page opens in a browser from OpenBI Server.
Pages
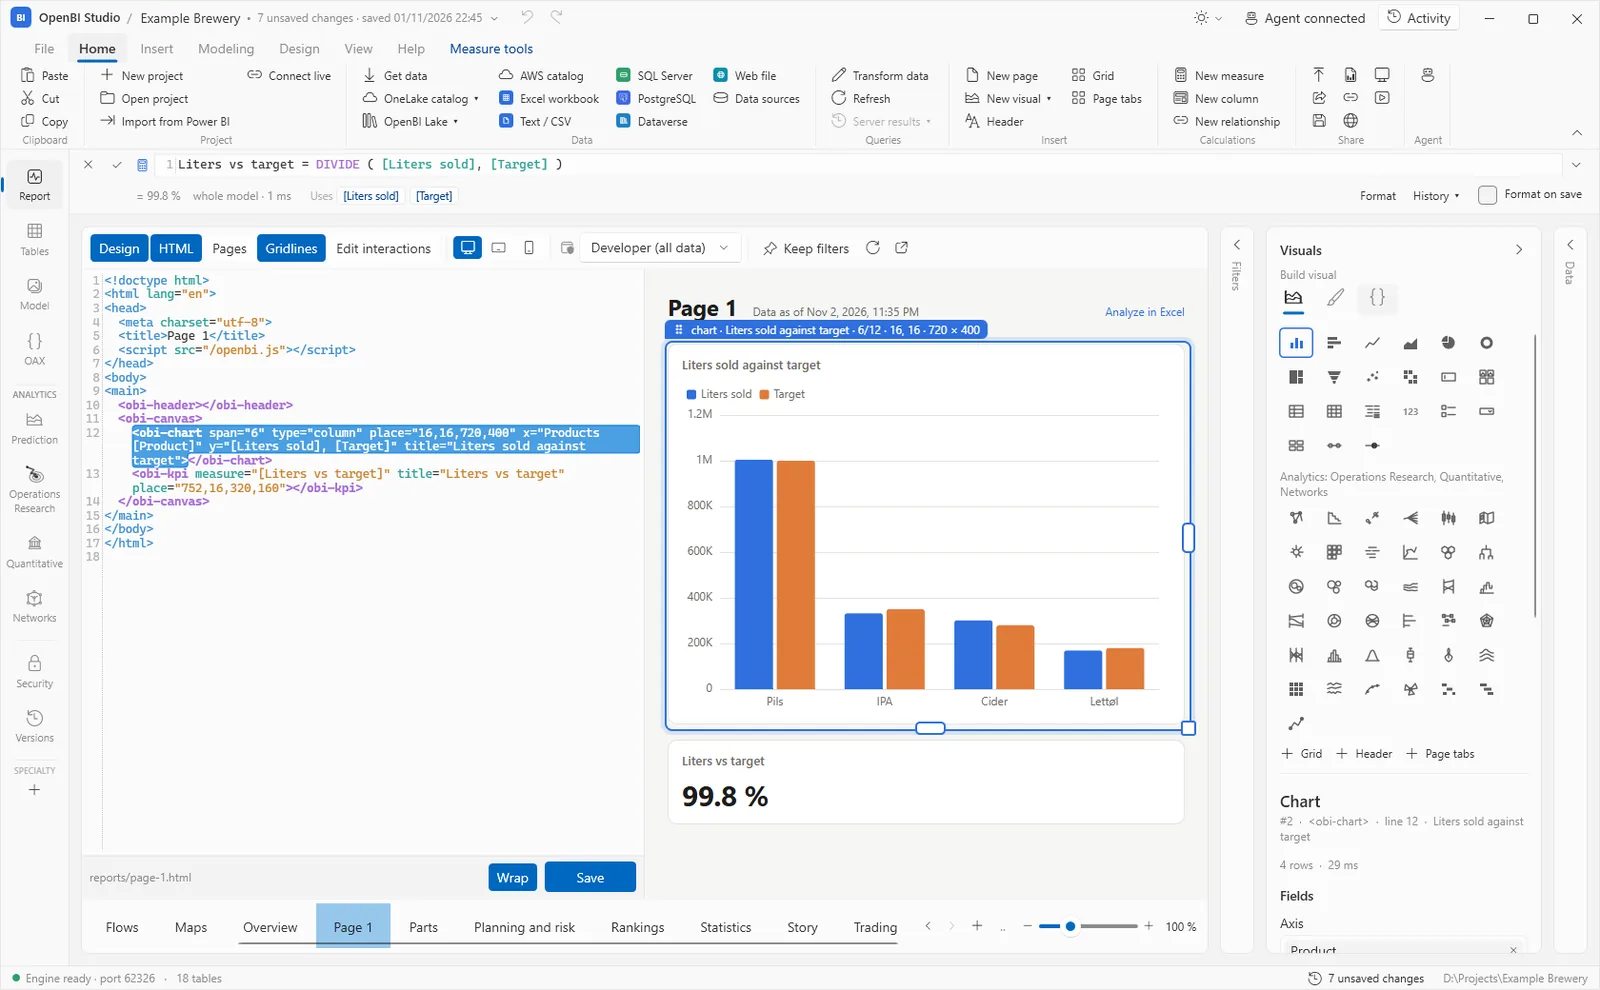
- New page (on Home or Insert, or + at the end of the page tabs) makes a blank page, “Page 1”, in the look of the page shown, with an empty canvas. A project’s very first page starts from the model: its main measures as cards, a chart over time and a breakdown.
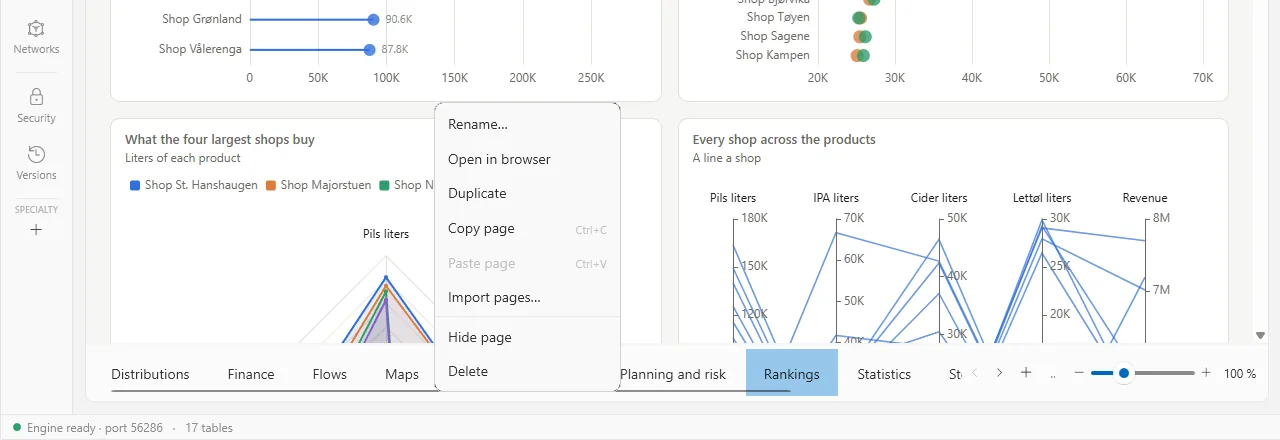
- Right-click a page’s tab: Rename…, Open in browser, Duplicate, Copy page, Paste page, Import pages…, Hide page, Delete. Double-clicking a tab renames it, and can change its address (
/r/<page>) too; links from other pages follow. - Drag a tab onto another to move the page, or turn on Pages to see them all as miniatures and drag them there.
- A hidden page is out of the navigation, presenting and slides, and stays on this computer when the project is published or shared.
There is no Save button: each change is written to the page’s file at once. Undo (Ctrl+Z) and Redo (Ctrl+Y) work on the report’s last change, whoever made it, you or an agent. A deleted page stays in the project’s earlier versions.
The Report view
- Design
- On (as a new page opens): a click selects a visual, a drag moves and sizes it, fields drop on it. Off: the page as its readers use it, with its slicers and drills.
- HTML
- The page’s HTML next to it: see The HTML view.
- Pages, Gridlines, Edit interactions
- All pages as miniatures; the canvas grid; which visual filters which (see Interactions).
- Width
- Desktop, Tablet (820 px) and Phone (390 px): the page at that width. Below 600 pixels a canvas stacks its visuals.
- View as
- Developer (all data), or a role of the model: the page under its row and object security.
- Keep filters
- The page opens with its slicers as they are now, for everyone.
- Reload, open in browser, zoom
- Reload the page (F5), open it in your browser, and zoom from 25 to 300 % (Ctrl+wheel).
On the right, three panes: Filters, Visuals and Data. Each folds to a strip, and the studio folds them by itself on a narrow window. Where Power BI has Visualizations and Format panes, OpenBI has Visuals, with three tabs: build, format, and HTML and actions.
Add a visual
With nothing selected, the Visuals pane says Add a visual: click one in its gallery and it is added to the page, on a canvas in free room. The gallery has the everyday visuals first (column, bar, line, area, pie and donut charts, treemap, funnel, scatter, heatmap, table, matrix, financial statement, card, slicers, a text filter, an image grid, a what-if parameter), then the analytics ones. Every visual is listed in Visuals.
With a visual selected, clicking a chart type changes the selected chart to it. Click the page’s background or press Esc first to add a new one. Insert on the ribbon has the same gallery, and the page elements Header, Grid and Page tabs.
Bind fields
- Select a visual: the Build visual tab shows its Fields, such as Axis, Values and Legend for a chart, Rows, Columns and Values for a matrix. Drag fields from the Data pane onto them; the × on a field removes it.
- Or drag a field onto the visual itself: a measure goes to its values, a column to its axis (or its legend, if it has an axis).
- Drag a field onto an empty part of the page: a measure makes a card, a column a table. Double-click a field to add it to the selected visual.
- A column dropped where measures go becomes its sum (numbers) or its count. OAX typed into a well offers Make it a measure of the model.
The Data pane ticks the fields the selected visual uses. A field’s menu in a table or matrix sets its format, Show value as, its name, alignment, style and tooltip.
Format and arrange
- The Visuals pane’s second tab is Format visual (with nothing selected, Format page: the page’s title, address, layout and chart theme). On a canvas, Position sets X, Y, width and height.
- A canvas is 1,280 × 720 by default, as a Power BI page. Visuals snap to an 8-unit grid and to each other’s edges (hold Alt not to); the arrow keys nudge one unit, Shift+arrow eight. View has Snap to grid, Lock objects and the fit and zoom choices.
- View › Panes › Selection lists the page’s visuals as layers, to hide or reorder them.
- Ctrl+C, Ctrl+X and Ctrl+V copy, cut and paste the selected visuals, to this page, another, or another project’s: see Several visuals at once.
- The page’s own text, its headings and paragraphs, can be selected and changed in Design too.
Several visuals at once
New in 0.3.74 In Design, select several visuals as in Power BI Desktop, then copy, cut, move or remove them together. On a Mac, Cmd stands for Ctrl.
- Ctrl+click adds a visual to the selection, or takes it out; a click alone selects one.
- Ctrl+A selects every visual of the page, its text boxes and pictures too.
- A drag on the empty canvas draws a box, and selects the visuals inside it.
- Esc lets go of them.
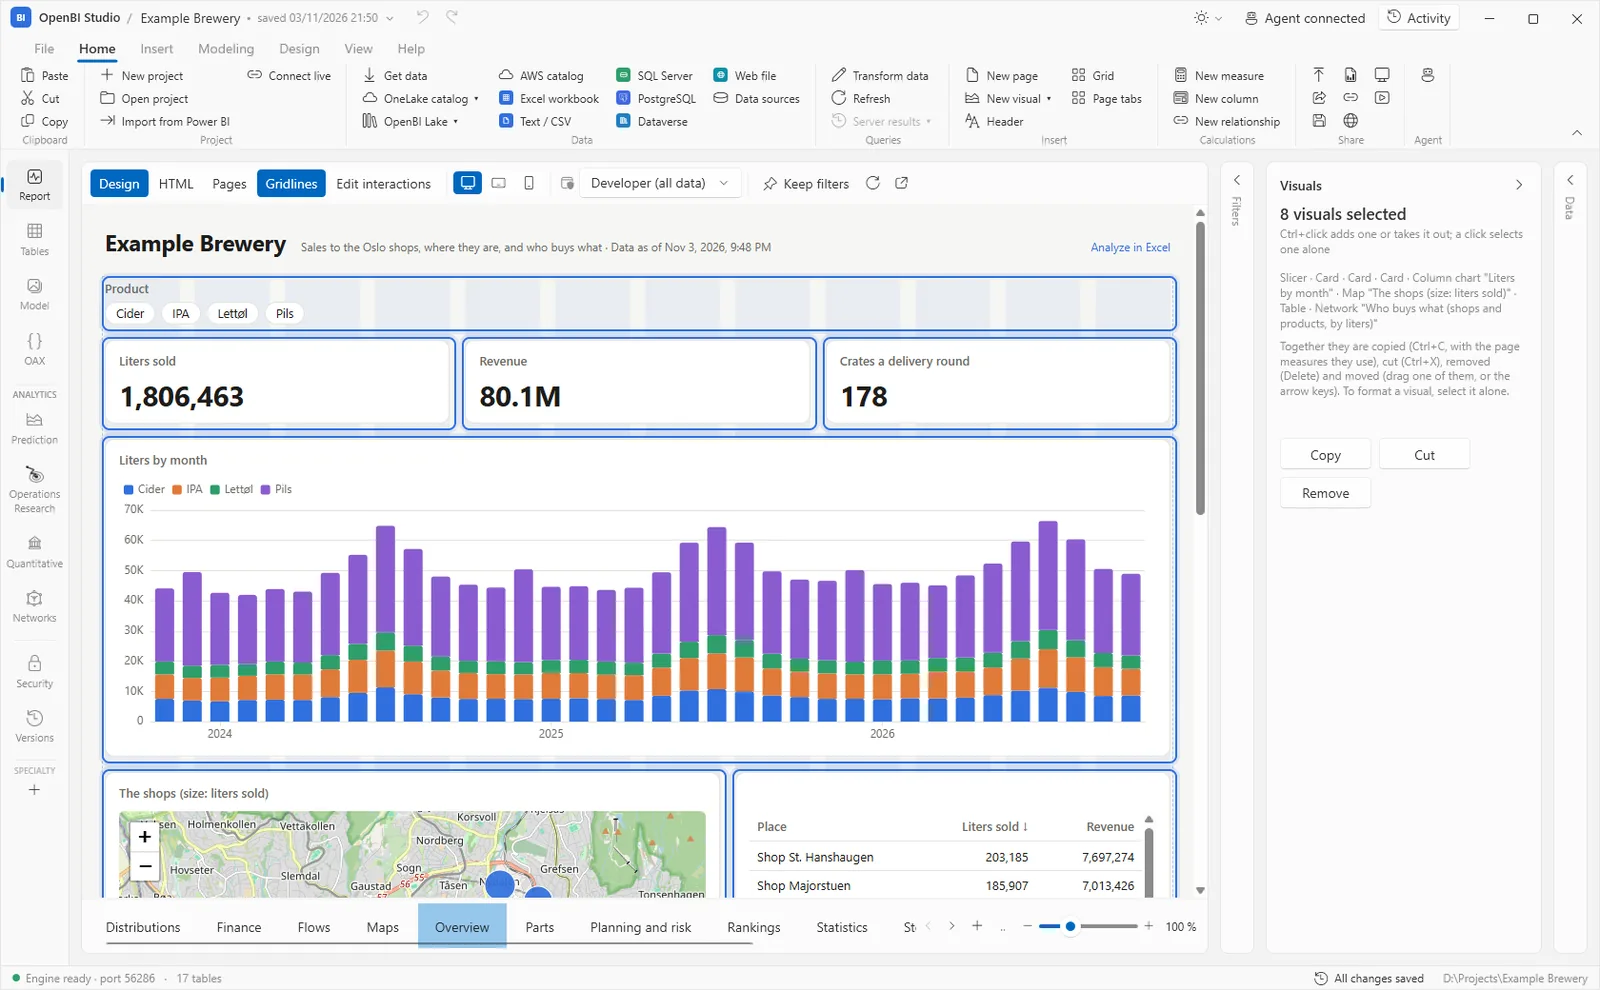
The Visuals pane then says how many are selected and what they are, with Copy, Cut and Remove. Dragging one of them, or the arrow keys, moves them all. Ctrl+C copies them with the page measures they use, Ctrl+X cuts them and Delete removes them. To format a visual, select it alone: OpenBI formats one visual at a time.
Ctrl+V pastes them on the page shown: the same page, another page, a page of another project, or a page in another studio window. On a canvas they keep their layout: where they were, when that room is free, or all moved a little down and right when they would cover the ones they were copied from. What is pasted is selected. Their HTML is on the clipboard as text too. Pasted into another model, the report’s status line names the fields that model doesn’t have: change those visuals’ fields. Each paste, cut or delete is one change, which Ctrl+Z takes back.
Pages from another project
New in 0.3.74 A whole page goes from one project to another with its page measures, its filters, size, background and chart style, and the pictures, fonts and styles it uses. A hidden page stays hidden. Power BI Desktop has no such command.
- Copy page and Paste page: right-click a page’s tab and choose Copy page (or Ctrl+C on the tabs). In the other project, in this window or another, right-click a tab and choose Paste page: the page comes after that one. Ctrl+V on the canvas pastes a copied page too.
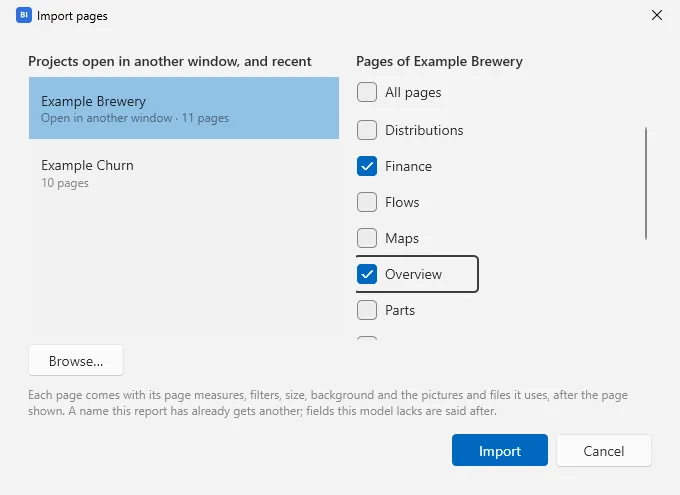
- Import pages…, on a tab’s menu or on Insert: choose a project, tick its pages, then Import. They come after the page shown.
Import pages… lists the projects open in other studio windows first, then the recent ones, each with how many pages it has, so the project you want is one click away; Browse… is for any other, an OpenBI or a Power BI project’s folder. All pages ticks every page of the project.
A page name or tab name the report already has gets another, and links between the pages imported follow them. The report’s theme applies to them, as Power BI’s does to what you paste. The fields of theirs this model doesn’t have are named after the import: change those visuals’ fields, or add them to the model. An import is one change: Ctrl+Z takes it back, the pictures and files it brought too. An agent does the same for you: see Copies of pages and projects.
Filters
The Filters pane has two parts: On this page (every visual of the page, slicers too) and On all pages (every page of the report). In either, Add a filter takes a column, typed or dragged from the Data pane, or OAX for a condition on any columns. A filter keeps values you tick, or a condition: is, is not, greater or less than, between, contains, or before and after for dates. The eraser clears it, the × removes it.
A filter for one visual only is that visual’s Filter, on its Build tab. Slicers are visuals: see Visuals.
A visual with a query of its own
A visual can draw a whole OAX query of its own instead of its fields: its dax attribute, written in the HTML view. Such a query takes the page’s filters only where it says so, with these placeholders:
{{filters}}- Every filter that reaches the visual: the slicers’ selections and the clicks it follows, the page’s and the report’s filters, and the visual’s own, each put in as a filter argument of the query’s
SUMMARIZECOLUMNSorCALCULATETABLE; nothing when there are none. A query without it takes none of the page’s filters, and the visual’s advice says so. {{filters except 'Date'[Year]}}- From OpenBI Studio 0.3.78: the same, less the filters of the columns it names (several with commas, or a table’s name for all of its columns), for a query that filters those columns itself. A condition on one of them together with another column stays.
{{values 'Date'[Year]}}- From OpenBI Studio 0.3.78: the column’s values that the visual’s filters leave, as a table: what is chosen, or every value when nothing is. It reads the selection apart from where it stands, so a
CALCULATEaround it changes nothing; put it in aVAR.MAXX ( {{values 'Date'[Year]}}, 'Date'[Year] )is the latest year chosen.
A chart of the three years up to the year chosen on a slicer, every other filter of the page still applying:
<obi-slicer field="'Date'[Year]" label="Year" single="true" default="latest"></obi-slicer>
<obi-chart type="column" title="Three years up to the one chosen" dax="EVALUATE
VAR _year = MAXX ( {{values 'Date'[Year]}}, 'Date'[Year] )
RETURN
SUMMARIZECOLUMNS (
'Date'[Year],
FILTER ( ALL ( 'Date'[Year] ), 'Date'[Year] > _year - 3 && 'Date'[Year] <= _year ),
{{filters except 'Date'[Year]}},
"Sales", [Sales]
)"></obi-chart>With 2025 chosen, the chart shows 2023, 2024 and 2025. REMOVEFILTERS ( 'Date'[Year] ) beside {{filters}} would not do it: in one CALCULATETABLE or SUMMARIZECOLUMNS, REMOVEFILTERS and ALL act before the filter arguments, whatever their order, so the slicer’s year comes back. For the same figure in every visual of the model, write it as a measure instead.
Interactions
A selection in one visual filters the others on the page. To change that, turn on Edit interactions above the page and select a visual: every other one shows whether a selection in it filters that one (a funnel) or not (⊘); click to switch. The visual that isn’t filtered keeps it as its Not filtered by setting.
Themes and looks
- Design › Themes: the report’s look on every page, Standard or another, light or dark, including Accessible and High contrast. Customize theme sets its colours, series colours, font and corners.
- Chart style, per page: Standard, Editorial (as the BBC’s charts), the ggplot looks, Tufte, Magazine and others.
- Page size (16:9, 4:3, Letter, A4, a tall page that scrolls, or your own), Page background and Wallpaper, for a canvas page.
The HTML view
HTML shows the page’s HTML beside it. Selecting a visual picks out its tag, and every visual is one element, such as <obi-chart x="Products[Product]" y="[Liters sold]">. Edit it and choose Save (Ctrl+S); Wrap wraps long lines. A page edited outside the studio, in an editor or by git, is picked up. The elements and their attributes are listed in Visuals.
What readers can do
- Every visual’s menu: Show OAX (its query), What filters this?, Expand, Copy data and Download CSV. Tables and matrices add Excel file (.xlsx), with their formats and a matrix’s levels as an outline, and, in the studio, a mail draft with the Excel file attached (Outlook on Windows).
- A chart’s axis with two levels (
'A' > 'B') drills down on a click; a matrix has drill buttons as Power BI’s; a visual with drill-through opens another page filtered on what was clicked. - Open in browser (on Home) opens the page in your browser, from this computer. Published to OpenBI Server, the same page opens there for everyone with access, filtered by their roles.
Pages also become slides, PDFs and PowerPoint files: see Slides, PDF and Paper.