Monitor and the activity log
What the server did and is doing: the Monitor lists every refresh, publish, export and lake job; the engines answer the reports’ queries within limits you set; and the log files say the rest.
The Monitor
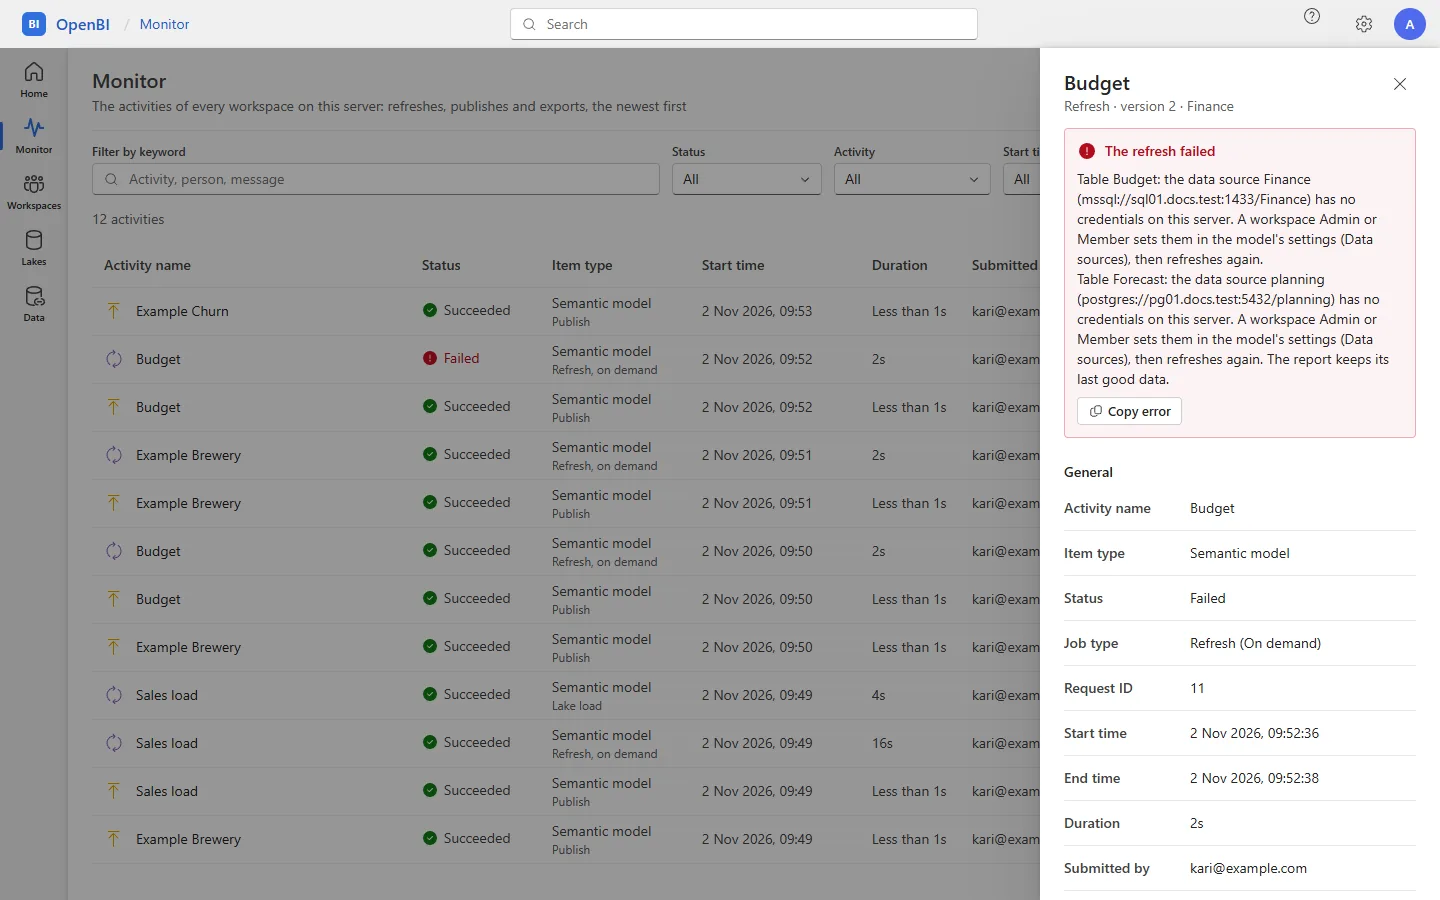
Choose Monitor in the portal’s rail, as the Power BI service’s monitoring hub. It lists the activities of the workspaces you are an Admin or a Member of, the newest first. The server’s administrators see every workspace under the domain they opened the server at, and the shared lakes’ jobs too. A shared lake’s maintenance and backups also show to the Admins and Members of the workspaces it is granted to.
| Column | Shows |
|---|---|
| Activity name | The item, or the lake |
| Status | In progress, Succeeded or Failed |
| Item type | Semantic model or Lake, and the kind of job: Refresh (scheduled, scheduled and run again, on demand, run again, or via API, as the command line’s are), Lake load, Lake maintenance, Lake backup, Lake backup verify, Lake restore, Publish or Export |
| Start time, Duration | When it began, and how long it took |
| Submitted by | Who asked for it: a person, the schedule or the command line; a lake’s own upkeep shows as maintenance |
| Location | The workspace |
Narrow the list with Filter by keyword, Status, Activity, Start time (the last hour, 24 hours, 7 or 30 days) and, with more than one workspace, Location. It shows the newest 500 that match.
Click a row for its Details: why it failed, with Copy error; its request ID, start and end, who submitted it and where it ran (Run by: the server, and in a cluster its node); for a refresh, its data snapshot and that file’s SHA-256. Copy all copies the lot, for a support case, and Open its settings opens the model’s.
Each model’s own Refresh history is in its settings.
From the command line
OpenBI.Server.exe activities --status Failed --hours 24
OpenBI.Server.exe activities --workspace "<name>" --kind refresh
OpenBI.Server.exe history --workspace "<name>" --item "<item>" --lines 30
activities lists the Monitor’s activities, newest first: --kind takes the kinds above, in lower case (refresh, lakeload, publish, export …). history lists one model’s refreshes: when, how, how long, and why one failed. With --json, both answer in JSON, for a script or your agent.
Where activities are kept
The activities are records in the server’s database, with its other records (see Where the server keeps its records). Who did what, beyond these jobs, is in the audit log (see The audit log).
Engines
A report’s queries run in an engine for its model’s version. The first person to open a version starts its engine; it stays loaded while people use it. Server administrators see the engines running now, each with its memory, in the portal: Admin portal, Server health (see The portal).
| Setting | Default | Means |
|---|---|---|
Engine:MaxEngines | 8 | How many engines run at once. The one used least recently stops first. |
Engine:IdleTime | 30 minutes | How long an engine nobody uses stays loaded. The next request loads it again. |
Engine:MemoryLimitMB | a quarter of the machine’s memory, at least 2 GB | Each engine’s ceiling. A query is refused at 80 % of it. |
Engine:TotalMemoryMB | half the machine’s memory | All the engines together, so that what else runs on the machine keeps the rest. |
Engine:StartTimeout | 5 minutes | How long a model may take to open. |
Engine:QueryTimeout | auto: 225 seconds | How long one query may run (see Query time limit). |
Engine:ResultCacheMB | 1024 MB, on | The memory each engine may keep queries’ answers in (see Answers kept). |
A query past its time limit stops with an error, and so does one nested too deep: the engine goes on with the others. An engine that still fails ends alone, never the server, and the next request starts that engine again. An engine that stops answering its health check twice is stopped and started the same way. The server’s log says when each engine starts and stops, and why.
These settings are in appsettings.json beside the program and settings.json in the data folder, which overrides it. The environment’s Engine__… variables override both.
Queries at once
Each engine runs at most so many queries at once; the others wait their turn, in the order they came, and a cheap one, such as a slicer’s list, passes the line. Past as many queries as there are cores, each one runs slower and together they get less done, so a line is faster for everyone. The limits are Analysis Services’ own, under OpenBI’s names:
| engine limits | Default | Means | Analysis Services |
|---|---|---|---|
--max-queries | auto: from the machine’s cores and memory | The queries one engine runs at once | ThreadPool\Query\MaxThreads |
--max-queries-per-user | auto: the fast cores, at most max queries | One person’s queries at once in one engine: a page of many visuals takes turns with everyone else’s | MaxThreadsPerClient |
--connection-pool | auto: twice max queries | The server’s connections to one engine for queries; requests past them wait in the server | ConnectionPoolSize |
--idle-time | 30m | How long an engine nobody uses stays loaded (1 minute to 30 days) | none: a database stays loaded |
--query-timeout | auto: 225 seconds | How long one query may run before its engine stops it (see Query time limit) | ServerTimeout (3600 s) |
--result-cache | 1024 MB, on | The memory each engine may keep queries’ answers in, or off (see Answers kept) | none: its storage engine’s cache only |
Each count is a number, 0 for no limit, or auto; the idle time and the query time limit are durations. The limits are per engine, not per server: two busy models share the machine’s cores. engine limits alone shows each value and where it comes from; with options, it writes them to settings.json, kept through upgrades, and the service takes them when it restarts:
OpenBI.Server.exe engine limits
OpenBI.Server.exe engine limits --max-queries 16 --max-queries-per-user 4 --connection-pool 64 --idle-time 10h
OpenBI.Server.exe service restart
At installation on Windows, the MSI takes them too: MAXQUERIES=16 MAXQUERIESPERUSER=4 CONNECTIONPOOL=64. On a Mac, sudo openbi-server engine limits …, then sudo openbi-server service restart.
Query time limit
New in 0.1.43 A query runs at most 225 seconds by default, as the Power BI service’s report visuals do. Past its limit, its engine stops it with Analysis Services’ words, “The XML for Analysis request timed out before it was completed. Timeout value: 225 sec.”, and goes on with the other queries. The time counts from when the query came, so one whose time ran out while it waited its turn isn’t run.
OpenBI.Server.exe engine limits --query-timeout 5m
OpenBI.Server.exe service restart
--query-timeout takes a duration such as 90s, 5m or 1h (at most a day), 0 or none for no limit, or auto for the engine’s own 225 seconds. It is Engine:QueryTimeout in settings.json, and the service takes it when it restarts. engine limits shows it as query timeout.
- A request may ask for less, never more. Excel’s own time limit is kept: a connection whose Timeout property asks for fewer seconds stops its queries then. An AI agent’s query has the server’s shorter limit for agents (see Limits).
- A page that no longer waits stops its queries. When a report page is closed or reloaded, or its filters change and a query isn’t asked again, the page cancels its queries, and the engine stops them, a model’s own data as well as a live one’s.
Answers kept
New in 0.1.44 Each engine keeps the answers to the queries it runs, and gives one again, at once, when the same person sends the same query, as the Power BI service’s query caching does. It is on by default: with Engine:ResultCacheMB not set, each engine may keep 1024 MB of answers, and never more than an eighth of its memory limit (Engine:MemoryLimitMB), counted with what its queries take.
- Each person’s answers are their own, kept by the person, their roles and their access: nobody is given an answer kept for someone else.
- Never kept: an answer that reads the clock’s time, chance or results kept apart from the model, such as
NOW,UTCNOW,RANDorPREDICT, through measures, calculation items, detail rows and roles too. One that readsTODAYis kept for that day only (UTCTODAY: that UTC day). - New data, new answers. After a refresh, the model’s engine starts again on the new data, so no answer kept from before is given.
- A kept answer says so: the header
X-OpenBI-Cache: hit, and"cached": truewith its own timings.
OpenBI.Server.exe engine limits --result-cache 256
OpenBI.Server.exe engine limits --result-cache off
OpenBI.Server.exe service restart
--result-cache takes the MB each engine may keep, a whole number up to 65536, or off (0 too) for none. It is Engine:ResultCacheMB in settings.json, and the service takes it when it restarts. engine limits shows it as result cache, such as default (on): 1024 MB per engine; each person’s answers their own, and doctor says when a value isn’t one it takes, using the default then.
Logs
The services write their logs in the data folder’s logs, a file a day, kept 30 days:
| File | Of |
|---|---|
server-<yyyymmdd>.log | OpenBI Server, and the commands that work on its records as the service does |
accounts-<yyyymmdd>.log | OpenBI Accounts, and the accounts commands that change something |
Each line is one event: its time in UTC, its level, where it comes from, and what happened, such as an engine started or stopped, a refresh failed or an e-mail not sent. The folder is C:\ProgramData\OpenBI Server\logs on Windows and /Library/Application Support/OpenBI Server/logs on a Mac. To read the newest lines:
OpenBI.Server.exe logs --lines 100
OpenBI.Server.exe accounts logs --lines 100
Both show 60 lines without --lines. When a service doesn’t start: on Windows, Event Viewer, Windows Logs, Application, under the sources OpenBI Server and OpenBI Accounts; on a Mac, launchd-server.log and launchd-accounts.log in the same logs folder.
Frequently asked questions
Why don’t I see a workspace’s activities?
The Monitor shows the workspaces you are an Admin or a Member of. A Contributor or Viewer sees none; ask a workspace Admin, or a server administrator, who sees every workspace of the domain.
Why is a report slow the first time in the morning?
Its engine stopped after 30 minutes unused, and the first request loads the model again. Raise --idle-time (see Queries at once).