The studio at a glance
OpenBI Studio is where you build a semantic model, its report pages and its analyses. This page names the parts of its window and says where a project’s files are, so the other pages can point at them.
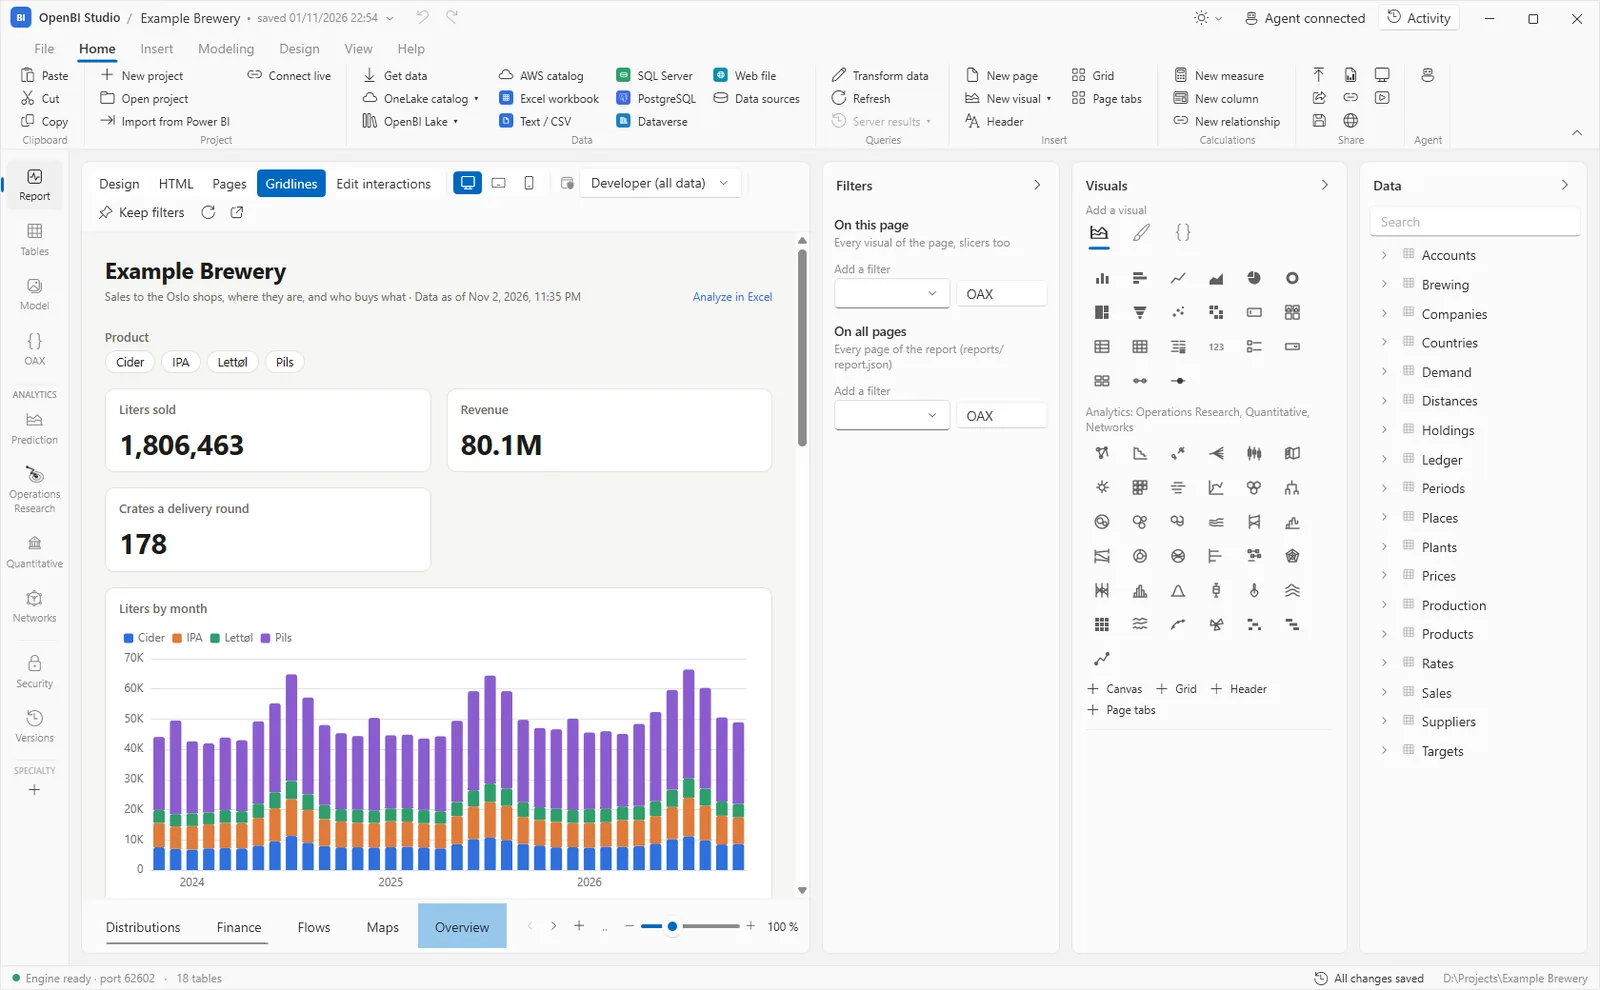
The window
- Title bar
- The project’s name, and whether its changes are saved as a version (“saved” and when, or “3 unsaved changes”). Its menu opens the project’s folder, copies its path, saves a version and shows the versions. Then Undo and Redo for report pages, the theme (Light, Dark or System default), the Agent button and Activity.
- Ribbon
- The commands, in tabs: see The ribbon.
- Bars under the ribbon
- Shown only when they have something to say: a newer version of the studio, data to refresh, or report pages someone edited on OpenBI Server.
- Views
- Down the left: see The views. They are greyed until a project is open.
- Formula bar
- Above the Report, Tables and Model views, when a measure or a calculated column is in it: see Measures and OAX.
- Status bar
- The engine’s state (“Engine ready”, “Loading data…”; click it to start a stopped engine again), the number of tables, a live connection’s server, the changes not yet saved as a version (click to save one), and the project’s folder.
The studio runs the OpenBI engine on this computer for the project you open, and the engine answers only the studio.
Measures, calculated columns, row filters and queries are written in OAX, OpenBI’s expression language. OAX is compatible with DAX, so a model from Power BI or Analysis Services works as it is, and it adds OpenBI’s own functions for predictions, survival, optimization, finance, networks and more (see OAX and DAX).
The views
| View | What it is for |
|---|---|
| Report | Report pages: charts, tables and cards bound to the model. Reports |
| Tables | Each table and its rows, sorted and filtered as you look; Get data, Mark as date table. Tables and relationships |
| Model | The diagram: relationships, measures, columns and their properties. Tables and relationships |
| OAX | OAX and SQL queries over the model, with timings, plans and the model analyzer. OAX queries and performance |
| Prediction | Forecasts, churn and scoring, learned from the model’s data. Prediction |
| Operations Research, Quantitative, Networks | Plans with OR-Tools, valuations and risk with QuantLib, networks with Open Graph. Operations research, Quantitative, Networks |
| Security | Roles, row filters, hidden objects and groups; see the model as a role or a user. Roles |
| Versions | The project’s versions: what each changed, and going back to one. Versions |
| Specialty | Tabs of the plug-ins you install, and + to install and turn them on. |
Right-click a view’s button and choose Open in a new window to have it beside another, on another screen for example; View › New window does the same.
The ribbon
- File
- New project…, Open project…, the two examples, Open recent, Import from Power BI…, Connect live…, Save version…, Share the model…, Open a shared model…, Publish…, Data sources…, Map tiles…, Close project.
- Home
- The everyday commands: the clipboard, the project, Get data and its sources, Transform data, Refresh, new pages and visuals, New measure, New column, New relationship, and Share: Publish, Share the model, Save version, Analyze in Excel, Open in browser, Present, Slides. Then Agent.
- Insert
- Pages (new, duplicate, rename, delete), every visual, the page elements Header, Grid and Page tabs, and Keep filters.
- Modeling
- Relationships and the diagram, measures and columns, Manage roles, New role, New group, New prediction, OAX query, Data sources and Refresh.
- Design
- The report’s Themes, Customize theme, Chart style, and a page’s size, background and wallpaper.
- View
- The views, New window, the page width (Desktop, Tablet, Phone), fit and zoom, gridlines and snapping, the panes, and Design, HTML and Reload page.
- Help
- About OpenBI Studio, Bill of materials, Third-party notices, the update settings, and which Python and R run scripts.
- Measure tools, Column tools
- Appear when a measure or a calculated column is in the formula bar: its name, home table, format, display folder, description and visibility.
Ctrl+F1 folds the ribbon to its tabs, and unfolds it.
Panes and the Activity panel
The Report view has three panes on the right, each folded to a strip with its arrow: Filters, Visuals (add a visual, its fields, its format and its HTML) and Data (the model’s tables and fields, to drag onto visuals). View › Panes also opens Selection (the page’s visuals as layers) and Performance (each visual’s query time).
Activity, in the title bar, shows what was done in the project and by whom: you, or an agent working in the studio. Each entry says what changed, and errors show in red. Open the log opens the folder where it is kept, a file a day: today’s as lines, the days before as Parquet files that OpenBI reads as a table. On a window narrower than 1,440 pixels the panel steps aside.
A project on disk
A project is a folder of plain files, and a git repository: each version you save is a commit. Nothing is hidden in a database, so you can read, diff and review it like code.
| In the folder | What it is |
|---|---|
<Name>.openbi | The project’s file: double-click it to open the project. |
<Name>.SemanticModel\definition\ | The model in TMDL, as Power BI writes it: model.tmdl, relationships.tmdl, a file per table with its columns, measures and query. |
reports\ | The report pages, an HTML file each, and report.json with their order, theme and the report’s filters. |
predictions\, operations-research\, quantitative\, networks\ | Notebooks, a folder each, with their versions. |
security\directory.json | Who has which role. The roles themselves are in the model. |
.openbi\ folders | This computer’s only, left out of git: the data snapshot the engine loads quickly, a live connection’s kept answers, the project’s own lake. |
File › New project… asks where to make the folder and the project’s name, and saves the empty project as its first version. A folder is a project when it holds a <Name>.SemanticModel folder: Open project opens any such folder, including a Power BI project’s (see Import from Power BI).
Files are written as you work. Saving a version is what makes a point you can go back to: see Versions.
Keyboard shortcuts
| What | Windows | Mac |
|---|---|---|
| Fold or unfold the ribbon | Ctrl+F1 | ⌘+F1 |
| Undo, redo a report change | Ctrl+Z, Ctrl+Y | ⌘+Z, ⇧+⌘+Z |
| Select several visuals, every visual of the page (Design on) | Ctrl+click, Ctrl+A | ⌘+click, ⌘+A |
| Copy, cut, paste the selected visuals (Design on) | Ctrl+C, X, V | ⌘+C, X, V |
| Copy a page, paste it after this one (on the page tabs) | Ctrl+C, Ctrl+V | ⌘+C, ⌘+V |
| Reload the report page | F5 | View › Reload page |
| Run an OAX query, or a notebook step | Ctrl+Enter (OAX view: also F5) | ⌘+Enter (OAX view: also F5) |
| Format OAX | Ctrl+Shift+F | ⌘+⇧+F |
| Open autocomplete in OAX | Ctrl+Space (it also opens as you type) | As you type |
| New project, open project, save a version | From the ribbon | ⌘+N, ⌘+O, ⌘+S |
| The first nine views | From the left | ⌘+1 … ⌘+9 |
On a Mac
The Mac studio has the same views, ribbon and panes, with the same names, and a Mac menu bar besides:
- OpenBI Studio: About OpenBI Studio, Check for updates…, Connect an agent…, Specialty modules…, and Quit.
- File as on the ribbon, ending with Quit OpenBI Studio; Edit: Undo, Redo, Cut, Copy, Paste, Select all.
- View: the views, Activity, Fold the ribbon, Theme, New window; Help: the website, Bill of materials, Third-party notices.
Where the two studios differ in what they can do, the page about it says so: Excel (Excel), live connections to Analysis Services (Live connections) and importing from an open Power BI Desktop, which runs on Windows only (Import from Power BI).