OAX queries and performance
The OAX view runs queries over the model, in OAX or in SQL, and shows where their time goes: the formula engine and the storage engine, step by step. It does what DAX Studio does for Power BI, inside the studio.
OAX, OpenBI’s expression language, is compatible with DAX: a query written for Power BI or Analysis Services runs here as it is, and can use OpenBI’s own functions besides (see OAX and DAX).
Choose OAX on the left, or Modeling › OAX query.
Run a query
Write an OAX query in the editor, as in DAX Studio: EVALUATE a table expression, with DEFINE MEASURE for measures of the query only (nothing in the model changes). Autocomplete and the error underlines work as in the formula bar. Run (F5 or Ctrl+Enter; on a Mac ⌘+Enter) runs the whole query, or only the part you selected.
DEFINE
    MEASURE Sales[Average price] = DIVIDE ( [Revenue], [Liters sold] )
EVALUATE
SUMMARIZECOLUMNS ( Products[Product], "Liters", [Liters sold], "Average price", [Average price] )
ORDER BY Products[Product]- Results shows the rows, and “N rows · N columns · N ms”. Copy results copies them as tab-separated text, which Excel pastes as a table.
- The Data card on the right lists the model: drag or double-click a field to write its name in the query. Right-click a table for Top 100 rows, Count rows or Its measures, evaluated.
- SQL switches the editor to DuckDB SQL over the model’s tables, with
dax('EVALUATE …')to run OAX inside it. Row security applies to OAX only. - Format (Ctrl+Shift+F) formats the selection, or the whole query.
- Log keeps what ran.
To run a query as a role sees the model, choose Query as this in the Security view’s See as (see Roles). A badge then shows over the editor; click it to run as yourself again.
Server timings
Turn on Server timings and run the query. The tab shows its Total, the Formula engine’s share and the Storage engine’s, the storage engine’s CPU and how parallel it ran, its number of queries and how many came from its cache. Below: a timeline, each storage-engine request with its rows and size, and the request’s own text, as SELECT … FROM … WHERE …. It also says on which machine the query ran, with its processor and memory.
On a live connection the tiles add the server’s time and its queries: see Live connections.
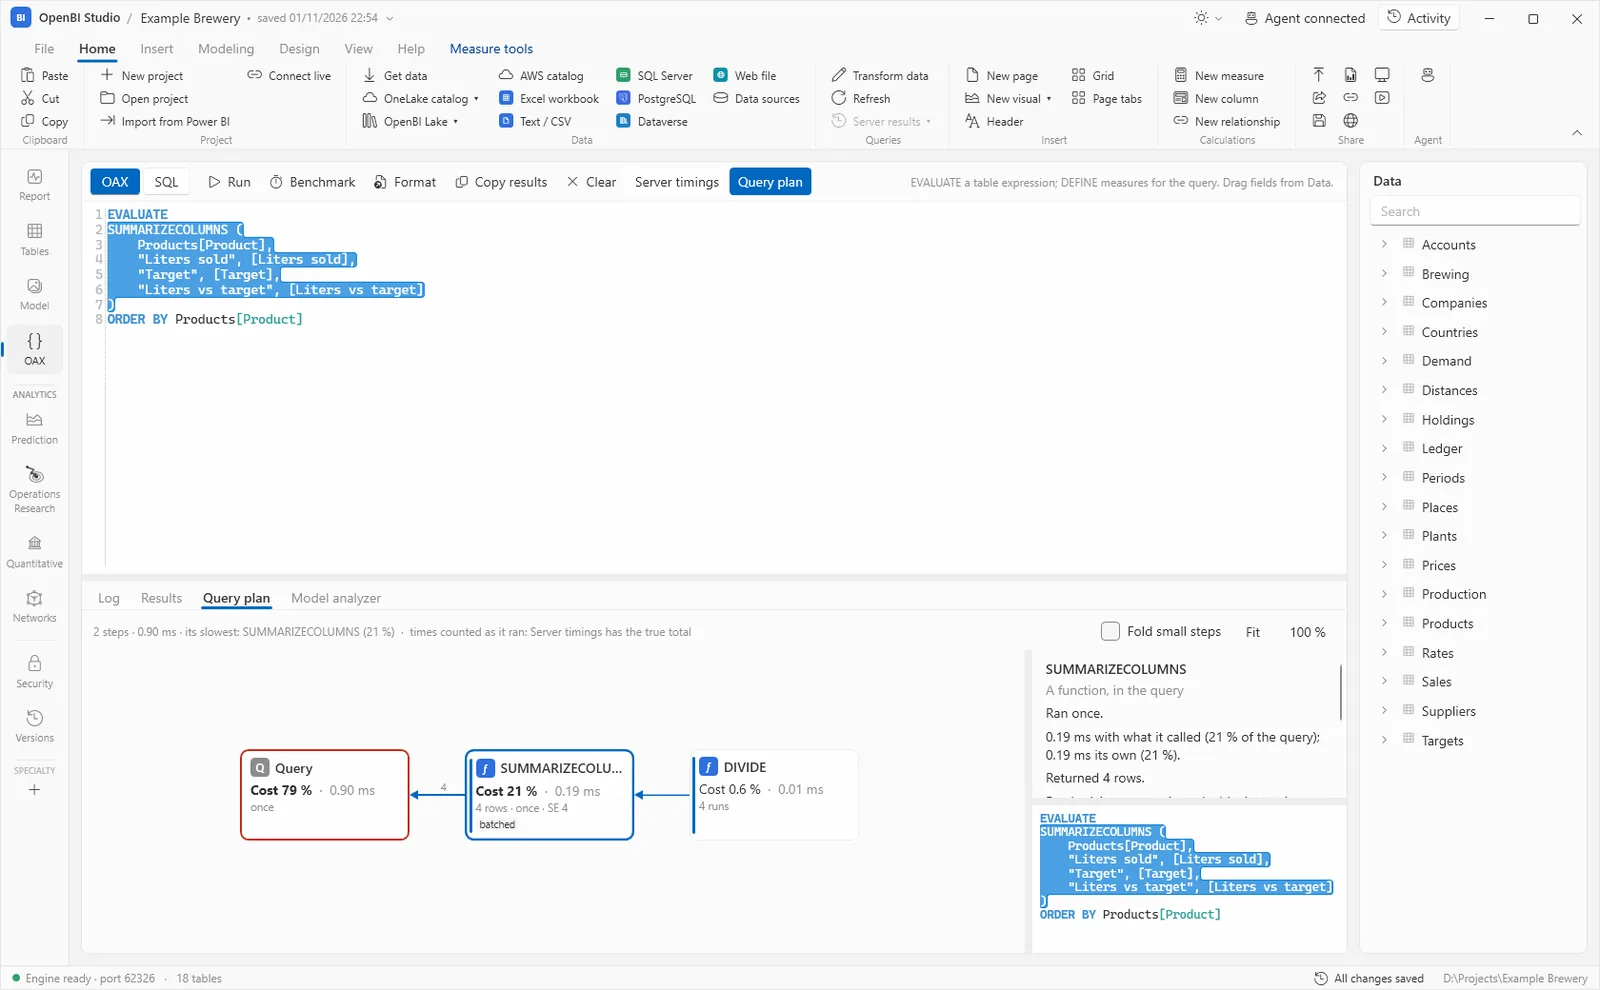
Query plan
Turn on Query plan and run the query. Its steps are drawn right to left, as SQL Server Management Studio draws plans: each step’s share of the time, how often it ran, its rows and how it ran; a thicker arrow carries more rows, and the slowest path is marked. Click a step to select its part of the query. Fold small steps folds those under half a percent; Fit and 100 % zoom.
A live model’s queries run on its server, so its plan is the server’s and isn’t drawn here.
A network function’s own steps
From OpenBI Studio 0.3.78, a NETWORK.* function (see the OAX network functions) shows its own work under its step, as steps marked ›. Click one, and the details say it is a step of that function’s own work (“A step of NETWORK.ROLLUP’s own work”), with its time, how often it ran, its rows and a note; the note shows in its tooltip too.
- Read rows: the rows of the links table. Its note says which of from, to and weight were read straight from the model’s columns and which were worked out in each row; an expression worked out in each row (
UPPER ( [Part] )) has its own steps under it. - Read starts: for a function that takes starts or seeds (
NETWORK.ROLLUP,NETWORK.REACH…), the starts it kept. - Number nodes: the network’s nodes, numbered by their values; the note gives its nodes and links (“16 nodes, 120 links”).
- Open Graph: …: the graph work, named by the Open Graph functions it calls (“Open Graph: og_rollup”), or Graph: … where the engine does it itself (“Graph: breadth-first search”).
- Build result: the rows the function returns.
So a slow network query shows whether its time went into reading the rows or into the graph work.
Benchmark
Benchmark runs the query five times and shows each run’s time and where it went, then the fastest, the median and the slowest, as DAX Studio’s Run Benchmark. Each run computes all of it: OpenBI keeps no answers between queries. On a live connection it runs five asking the server (cold) and five from OpenBI’s kept answers (warm).
Model analyzer
The Model analyzer tab shows what the model takes in memory, table by table and column by column, as VertiPaq Analyzer does. View metrics reads it: the model’s own, or a live model’s from its server.
- Pages: Tables, Columns, Relationships, Partitions and Summary, with cardinality, total size, data and dictionary size, encoding, the share of the table and of the model, and relationships’ missing keys.
- Import… opens a
.vpaxfile from DAX Studio, Tabular Editor or Bravo, without a model connected. - Export… saves a
.vpaxfor a server’s model, and OpenBI’s own metrics as a.jsonfile for an OpenBI model. Copy copies the view as a table.
Performance of a report’s visuals
In the Report view, View › Panes › Performance opens the performance analyzer: each visual’s query time and rows, with Copy query to bring its OAX here.