Tables and relationships
The Model view draws the model’s tables and how they relate; the Tables view shows their rows. Here you relate tables, set how columns show and sort, set the model’s culture and locale for import, and mark a date table.
The Model view
Choose Model on the left. The list of tables, their measures and columns is on the left (search it with Search tables, columns, measures), the diagram in the middle, and the properties of what you select on the right.
- Each card shows a table’s rows and columns with their type (
123,1.2,abc,date,t/f) and its measures, folded under “N measures”. - A solid line is an active relationship, a dashed one inactive;
✱marks the many side and1the one side. Hover a line to read it, click it to select it. - Drag a card by its title to move it, its right edge to widen it. The wheel zooms; drag the background to move around. Arrange lays the tables out again and Fit fits them in the window.
Every change here is written to the model’s TMDL files at once, and is part of the project’s next version.
Relationships
Drag a column onto the matching column of another table. The New relationship form opens on the right, filled in: the column with unique values is the one side, and if neither is unique the form says it will be many to many. Check it and choose Add.
Or choose Relationship above the diagram (or New relationship on the Home or Modeling tab) and fill in the form yourself:
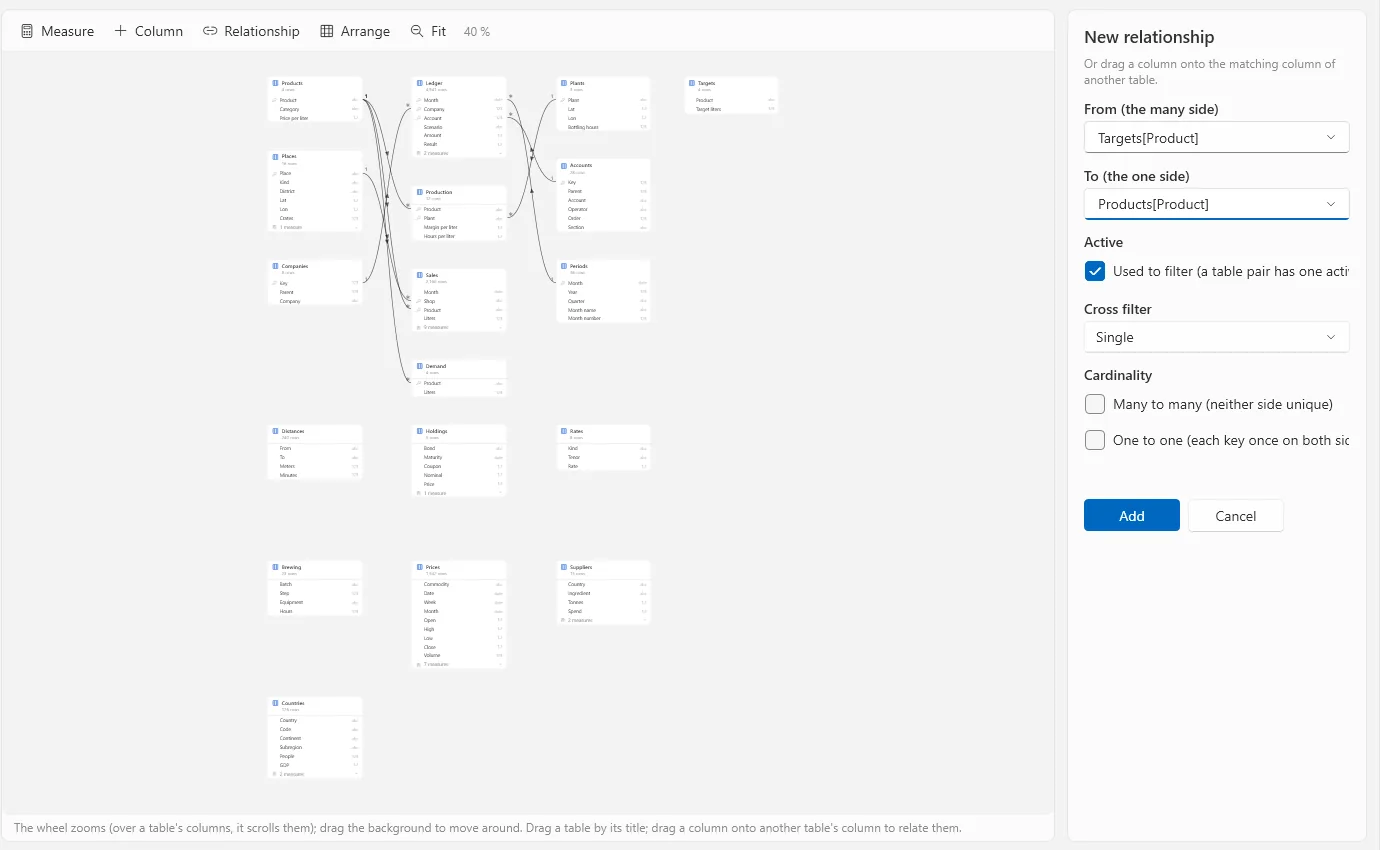
- From (the many side), To (the one side)
- The two columns, as
Table[Column]. Without the boxes below, a relationship is many to one. - Active
- Used to filter. Two tables have at most one active path between them; an inactive relationship is used where a measure says so, with
USERELATIONSHIP. - Cross filter
- Single: the one side filters the many side. Both: each filters the other.
- Cardinality
- Many to many (neither side unique), or One to one (each key once on both sides: filters both ways).
Select a relationship’s line to change it (Save) or remove it (Delete). If a model has relationships Power BI would refuse too, such as a second active path, the studio says so and offers to delete the duplicate or make it inactive.
Columns and tables
Select a column, in the diagram or the list, to set:
- Name and Format
- The format is a format string, as in Power BI:
#,0,#,0.00,0.0 %,yyyy-MM-dd,MMM yyyy, or one of your own. - Display folder
- The folder the column shows in, in the Data pane;
a\bfor a folder inside another. - Sort by column
- Another column its values sort by: a month’s name by its number.
- Data category
- What the values are, for maps, links and pictures: Address, City, Country, Latitude, Longitude, Place, WebUrl, ImageUrl and others.
- Description and Visibility
- What it means, for report authors; Hidden from report authors keeps it in the model but out of the Data pane.
A column’s data type comes from its table’s query: change it there, with a Data type step (see Transform data). A table has a Description and Visibility, and New measure here and New column here.
Culture and Locale for import
New in 0.3.79 Click the diagram’s background, so that nothing is selected: the properties on the right are the model’s own, with Save under them.
- Culture
- How OAX’s
FORMATand the report pages write numbers and dates (en-US:1,234.50and10/22/2026; nb-NO:1 234,50and22.10.2026), and how text sorts. - Locale for import
- How Transform data reads and writes text, numbers and dates when a step names no locale of its own: Changed Type, Promoted Headers,
Text.From,Number.From,Date.From. In nb-NO"1,5"is one and a half and 03/04/2026 is 3 April; in en-US"1,5"is fifteen and 03/04/2026 is 4 March. It is Power BI Desktop’s File › Options › Current file › Regional settings › Locale for import, kept in the model’s TMDL assourceQueryCulture.
A new project takes both from this computer’s region (Windows’ regional format; on a Mac, macOS’s region), not from the language of the studio, as Power BI Desktop gives a new file its locale for import. A project that names no locale for import, such as one made by an OpenBI Studio before 0.3.79, reads in the model’s culture, as Desktop does; a project imported from Power BI keeps its own. To change it, choose another from the list or type its name (en-GB, it-IT), then Save. A live connection has none: its data is its server’s, and no Power Query runs in the studio.
Data already loaded stays as it was read until you refresh it, as in Desktop: the tables read in the earlier locale show the stale-data bar under the ribbon, and Refresh reads them in the new one. A query that reads a file written in another locale names its own in its step: in Transform data, Using locale… (see Transform data).
Calculated columns
Select the table, then New column (on Home or Modeling, or Column above the diagram). The formula bar opens with Column = : write its OAX, evaluated on each row, and press Enter. The Column tools tab then sets its format, data category, sort order, folder and visibility. On a Mac, Column above the diagram opens a form in the properties pane instead, with Name, OAX and Format. OAX, OpenBI’s expression language, is compatible with DAX: calculated columns from Power BI work as they are (see Measures and OAX).
The Tables view
Choose Tables on the left to see a table’s rows. Each column’s header menu sorts it and filters it (by values, or Number filters…, Text filters…, Date filters…); Clear filters shows every row again. The sort and filters run in the engine over all the rows, the grid shows up to 1,000, and they are this view’s only: they don’t change the model.
A date-time shows its fraction of a second where it has one, as OpenBI holds it: to 1/300 of a second, as Power BI Desktop does (09:55:26.003333). The grid shows the engine’s values, not the column’s format string.
Above the rows, the table’s measures and calculated columns: click one to see its OAX in the formula bar.
Date tables
Time intelligence, such as TOTALYTD, SAMEPERIODLASTYEAR or DATEADD, works by a date table: a column of dates, each once, none blank, every day from the first to the last. Show the table in the Tables view and choose Mark as date table, then its Date column. The button then says Date table: <column>; choose (not a date table) to undo it.
The Data pane
The Report view’s Data pane, and the OAX view’s, list the tables and their fields: in each table its folders first, then measures and columns, by name. Hidden fields don’t show. Search finds a field by its name, its table’s or its folder’s. Click a measure or a calculated column to see its OAX in the formula bar.
Display folders group fields: Sales\Targets is a folder inside another, and Prices;Targets puts a field in two. On a live connection each table also has Server measures and Own measures (see Live connections).
Not in the studio yet
Hierarchies, calculated tables and calculation groups have no commands of their own in OpenBI Studio 0.3.79. A model imported from Power BI keeps the ones it has and OpenBI uses them: a calculated table’s card says “calculated” and shows its OAX, read-only. A column’s Summarize by can’t be set in the studio either.