Measures and OAX
Measures are the model’s numbers, written in OAX, OpenBI’s expression language. In OpenBI Studio you write them in the formula bar, and every report page, query and agent uses them by name.
OAX is compatible with DAX, the language of Power BI and Analysis Services: measures written there work in OpenBI as they are, and OAX adds functions of its own (see below, and OAX and DAX).
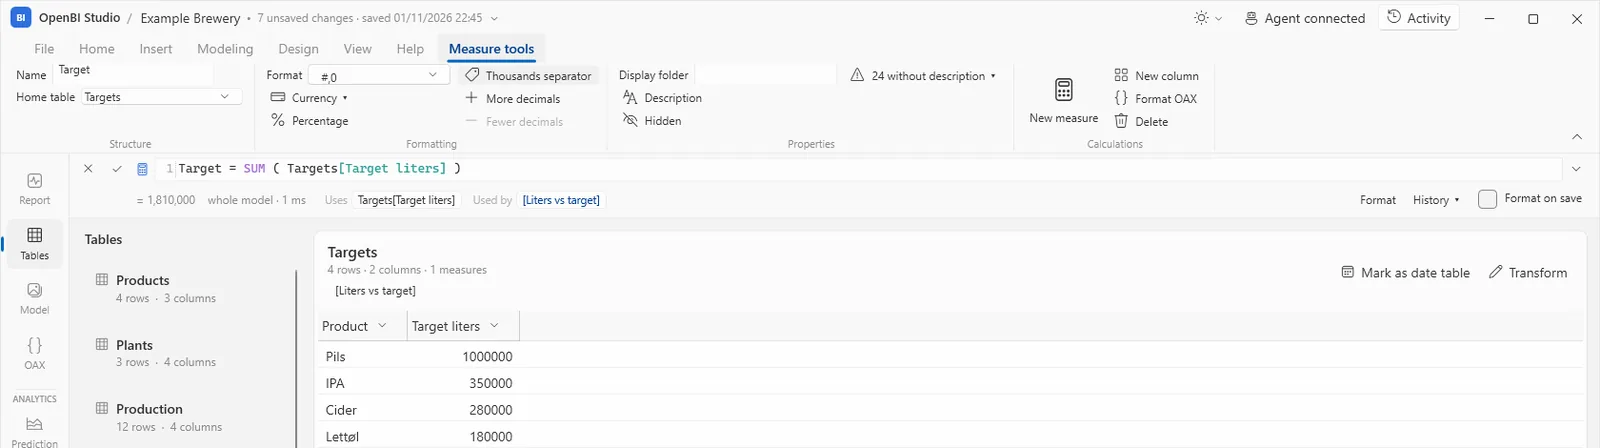
A new measure
- Show the table the measure belongs to: select it in the Tables view or the Model view, or click one of its fields in the Report view’s Data pane.
- Choose New measure on the Home or Modeling tab. The formula bar opens with
Measure =. - Write its name and its OAX, for example
Average price = DIVIDE ( [Revenue], [Liters sold] ). The line under the bar shows its value over the whole model, or the error and where it is. - Press Enter to save it (Shift+Enter for a new line, Esc to go back to what is saved).
Nothing is created until you press Enter. To change a measure, click it in the Data pane, the Tables view or the Model view: its OAX opens in the formula bar. Uses and Used by under the bar list the measures and columns it depends on and those that depend on it; click one to open it.
On a Mac, Measure above the Model view’s diagram opens a form in the properties pane (Name, OAX, Format, Display folder, Description) with Check and Add; New measure on the ribbon uses the formula bar, as on Windows.
Measure tools
While a measure is in the formula bar, the ribbon shows the Measure tools tab:
- Name, Home table
- Renaming it renames it in the OAX and the report pages that name it. The home table is where it is listed; it may use any table.
- Format, Currency, Percentage, Thousands separator, More decimals, Fewer decimals
- How its values show: a format string such as
#,0.00,0.0 %oryyyy-MM-dd. - Display folder
- The folder it shows in, in the Data pane;
a\bfor a folder inside another. Name folders for why measures exist, the question or page they serve, so the Data pane reads like the business does. - Description, Hidden
- What it means, in one line of the business’s words: what report authors, people on the server and agents read instead of the formula (see Describe your measures); hidden keeps it in the model, out of the Data pane.
- New measure, New column, Format OAX, Delete
- The tab’s boxes wait while the bar has OAX not saved: save it (Enter) or cancel it (Esc) first.
A calculated column gets the Column tools tab instead, with its data category and sort order.
Describe your measures
New in 0.3.72 People and agents understand a measure by its name, description, format and folder, not by its formula. On OpenBI Server, Viewers and their agents get descriptions, not formulas (unless the workspace’s Admins let them see formulas), so a measure without a description is the weak point of a model. The studio says which ones have none:
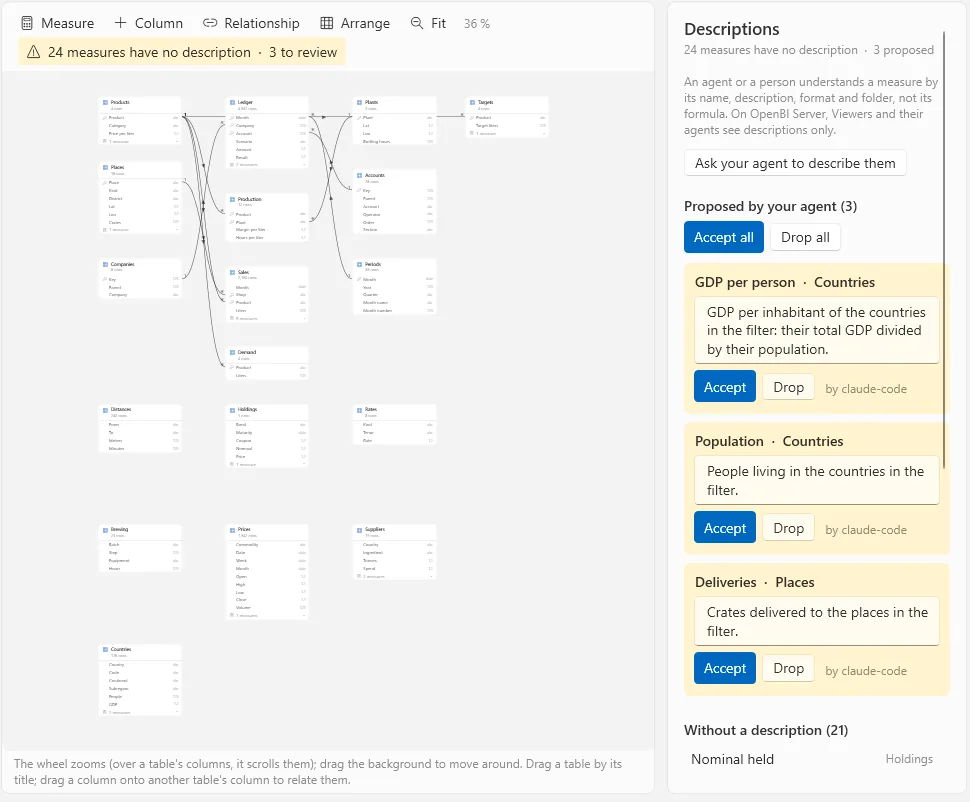
- In the Model view, the toolbar says how many visible measures have no description, such as 12 measures have no description. Hidden measures, the helpers report authors don’t see, aren’t counted. A click opens the Descriptions page in the properties pane.
- On the Measure tools tab, 12 without description lists them in its menu (a click opens the measure with the caret in its Description box), with Show the list and Ask your agent to describe them. With none left it reads All described.
The Descriptions page has three parts:
- Ask your agent to describe them copies a request to paste in your agent’s chat (Claude, Cursor, ChatGPT). The agent reads each measure’s formula, format, folder and the tables that slice it, and drafts one line for each in the business’s words. If no agent has called the studio lately, the page offers Connect an agent….
- Proposed by your agent: each proposal beside its measure, its text editable first. Accept saves it as the measure’s description, Drop throws it away; Accept all and Drop all do every one. Nothing is saved until you accept.
- Without a description: the rest, each a click from its Description box, to write it yourself.
Publish and Share the model say it too, before anything leaves: Describe the measures first?, with Describe them now, which opens the list and sends nothing, Publish anyway (or Share anyway), and Cancel. It is a reminder, never a refusal. Agents use the tools measures_undescribed and measure_describe: see How the agent works.
Writing OAX
- Autocomplete offers functions, tables, columns, measures and variables as you type;
[lists columns and measures,'tables. Ctrl+Space opens it, Tab or Enter takes the choice. - Parameter hints show a function’s arguments above the line, the current one in bold; Ctrl+Shift+Space opens them.
- Errors are underlined a moment after you stop typing: red where the OAX can’t be read, orange for a name nothing in the model has. Hover for the message.
- For a long measure, Expand in the Model view’s properties opens the OAX in a window of its own.
The same editor, autocomplete and checks are in the OAX view (queries), the role filters and notebooks’ OAX steps.
Formatting OAX
OpenBI has its own formatter, built in and offline, which lays OAX out as DAX Formatter lays out DAX. Ctrl+Shift+F (on a Mac ⌘+⇧+F) formats the OAX wherever you edit it; so do Format under the formula bar and Format OAX on Measure tools. Ctrl+Z undoes it. Tick Format on save to format every measure as you save it.
The Expand window also chooses the style: Long lines or Short lines, a space after a function’s name, and the separators (A, B, 1.5 or A; B; 1,5).
History, and an agent’s proposals
History under the formula bar lists the measure’s OAX in the project’s saved versions: choose one to put it back in the bar, and Enter saves it.
An agent working in the studio can propose a measure, or a faster version of one, without saving it: the studio puts it in your formula bar, and the line under it begins “The agent proposes:”, with its note and the value. Enter saves it, Esc drops it.
Calculation groups
OpenBI evaluates calculation groups as Power BI does, in their order of precedence. A model imported from Power BI keeps its calculation groups. The studio has no command to make or change one yet.
OpenBI’s own OAX functions
Besides the functions it shares with DAX, OAX has functions of its own. They work in measures, queries and report pages, and appear in autocomplete. Power BI doesn’t have them, so a measure that uses one works in OpenBI only. Every OAX function, those it shares with DAX and its own, is in OAX functions.
PREDICTOpenBI- A prediction’s score for each row, from the version in use (see Prediction).
OPTIMIZE,OPTIMIZE.VALUEOpenBI- An operations research plan solved again with other values, and its objective: what-if pages for plans (see Operations research, Quantitative, Networks).
NETWORK.*OpenBI- Networks on the rows in view: nodes, edges, layout, paths, centrality, communities, similarity, spreading (SIR), cycles, reach, flows, triads and cliques.
SURVIVAL.*OpenBI- How long until an event: Kaplan-Meier curves, the log-rank test, life tables, the hazard, Cox models with their predictions, curves and proportional-hazards test, and penalized Cox (the lasso).
QUANT.*OpenBI- Valuations row by row with QuantLib: a bond’s price, yield, accrued interest, duration, convexity and DV01; an option’s price, greeks and implied volatility; FX forwards; curves.
PCA.*,KMEANS,KMEANS.CENTERS,KMEANS.ELBOW,UMAPOpenBI- Many variables at once: principal components, k-means clusters, UMAP maps.
DECOMPOSE,HISTOGRAM,DENSITY,BOXPLOT,TRENDLINE,CORREL.SPEARMANOpenBI- Statistics as tables: a time series’ season, trend and remainder, a distribution’s bins, curve or quartiles, a trend line with its fit.
IMAGECOLORS,IMAGECOLOR,COLORNAMEOpenBI- The colours of a picture at an address, and a colour’s name.