Operations research, Quantitative, Networks
Three views take the model’s data further: Operations Research decides (a production plan, routes, a roster) with OR-Tools, Quantitative values positions and measures their risk with QuantLib, and Networks finds who is connected and who matters with Open Graph, Norway Analytics’ own graph library. Each is a notebook, and what it finds becomes a table of the model once a person approves it.
All three work alike. Choose the view on the left, then +: Clean slate, With the agent, or an example. The notebook reads the model with OAX queries in OAX steps, and its C# steps decide, value or measure. Its last step saves what it found as a version, a draft until someone else approves it. See Notebooks for the steps, running and the paper, and the Notebooks section for the code of each: Optimization, Quantitative finance and Networks.
Operations Research
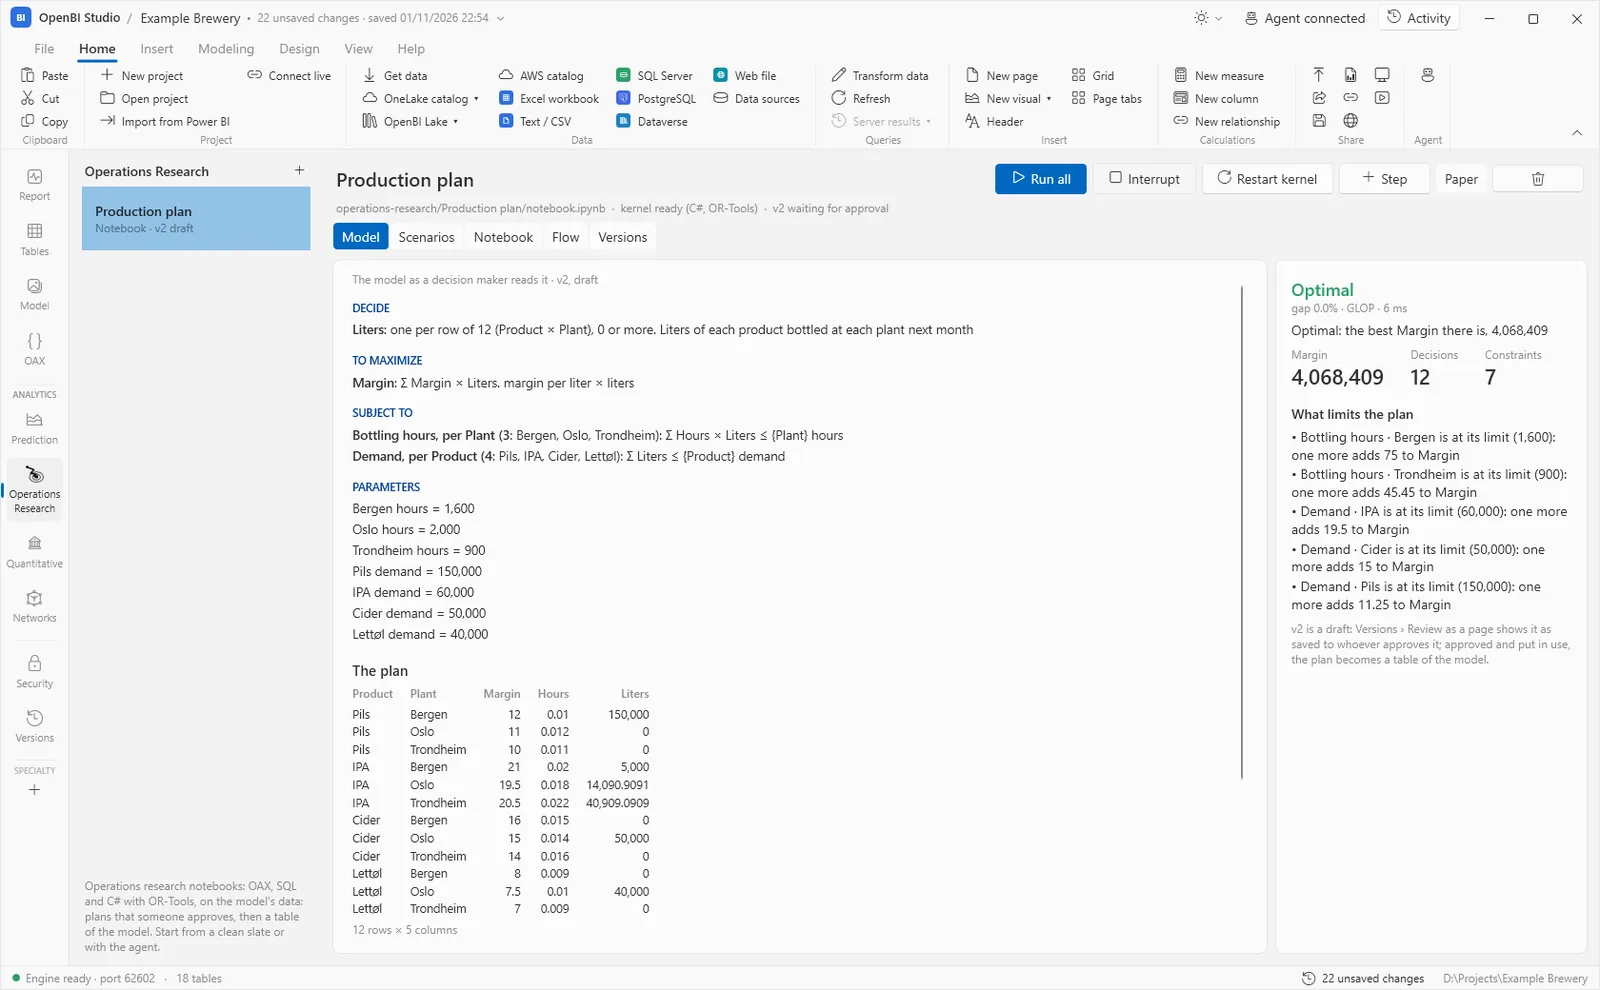
Plans that decide given what limits them: how much each plant should bottle, which shops each van visits and in what order, who works which shift. A notebook makes a decision per row of an OAX step, says what to maximize or minimize, and adds the limits, with capacities and demands as parameters. Solving it gives the plan in words, and what limits it: each binding limit’s shadow price, what one more unit of it would be worth.
- Model tab: the model as a decision maker reads it (what it decides, to maximize what, subject to what), the plan, and the solution.
- Scenarios tab: other values of the parameters, solved and compared with the plan, such as “Bergen +10 %”.
- Routes tab, for routing: each vehicle’s stops, on a map when the places have coordinates.
Before a plan is approved, Review as a page in its Versions tab writes a review page of the version exactly as saved: its objective, its budget, each binding limit in a sentence, the allocation and the slack. Approve it there. A review page carries the plan’s numbers, which the model’s roles don’t protect, so it stays on this computer when the project is shared or published, unless you choose it.
Quantitative
Valuations and risk as of a date: bonds, curves, forwards, options, credit and counterparty exposure. A notebook builds the market (a curve bootstrapped from rates, quotes, FX), values the positions, and adds risk: value at risk, expected shortfall, what drives it. The market is frozen with each run.
- Run tab: totals, risk, notes and each position’s value.
- Market data tab: the curves’ zero rates and pillars, the quotes and FX the run used.
In OAX, QUANT.* functions price bonds and options row by row (see OpenBI’s own OAX functions).
Networks
Who is connected, and who matters: customers and products, accounts and payments, people and teams. A notebook measures a network from a table of edges: each node’s degree, weight, PageRank, betweenness, community, and whether it is a cut point.
- Graph tab: the network drawn, coloured by community, sized by PageRank, cut points ringed.
On report pages, the <obi-network> visual and the NETWORK.* functions measure a network live, on the rows in view (see Visuals). From 0.3.76 they measure it with Open Graph: a drawing’s positions and some communities can differ from 0.3.75’s (see Open Graph).
Results in the model
The notebook’s Versions tab approves a version as a prediction’s is approved (see Prediction). Once a version is in use, Use in the model makes its rows a table of the model, named after the notebook: it refreshes, relates and is secured like any table. In a notebook, Results.Load("name") reads them.
What-if pages
For a plan or a valuation in use, What-if page (on the Model tab, or the Run tab) writes a report page with sliders the engine answers as they move: the plan solved again with other capacities (OPTIMIZE), or the positions priced again under a rate shock (VALUATION). To hand it to someone without OpenBI, save it as an offline lab (see Slides, PDF and Paper).
The examples
- Example Brewery (File › Open the example project) has an example for each view: Production plan and Delivery routes (Operations Research), Bond portfolio (Quantitative) and Who buys what (Networks). Each card writes the notebook from the project’s tables; Run all runs it.
- Example Churn (File › Open the churn example) is churn done properly, in seven notebooks: survival, a calibrated risk model, uplift from an experiment, the experiment’s design, an integer plan, contagion and monitoring, each checked against the synthetic data’s truth.