Notebooks
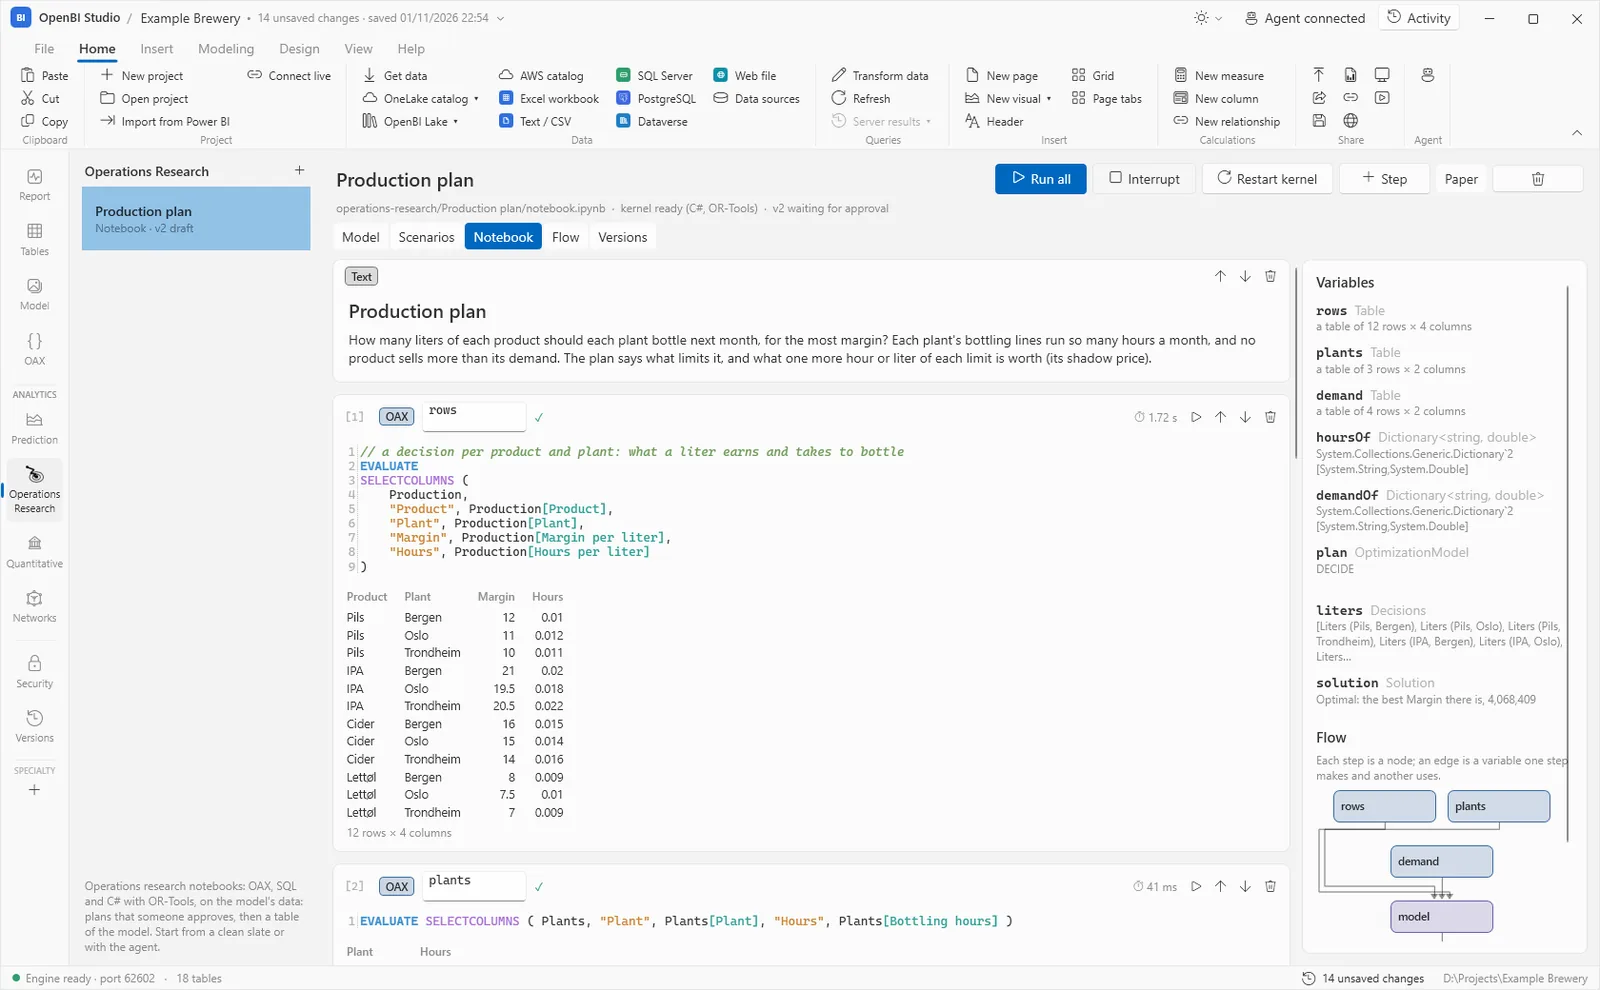
A notebook is analysis as code, beside the model: steps in OAX on the model, SQL over the sources, and C# with OpenBI’s library, each showing what it found. Predictions, plans, valuations and networks are all notebooks, and their results come back into the model once a person approves them.
Where notebooks are
Notebooks live in the four analytics views on the left: Prediction, Operations Research, Quantitative and Networks. Each view lists its notebooks, with their state (“v2 in use, v3 draft”). On disk, a notebook is notebook.ipynb in a folder of its own, such as operations-research\Production plan\, in Jupyter’s format, and versioned with the project. A name is used once across the four kinds.
Make one
In any of the four views, choose + by its list, then:
- Clean slate: you name it and write the steps. For a plan, a valuation or a network, the first steps are there to start from.
- With the agent: say the question in your words; an agent working in the studio writes the notebook from your model, runs it and tells you what it found. Everything it does is code in the notebook, for you to read and change.
- An example: in Example Brewery and the projects with the same tables, Example: … cards write a working notebook from the project’s data. In Prediction, the patterns (churn, forecast and others) do the same from any model: see Prediction.
Steps
Add a step with the buttons at the end of the steps, or Step at the top:
- Text
- Markdown: headings, lists, bold, italic and code. Say what the notebook is for, and what each part finds. Click the text to edit it.
- OAX
- An OAX query on the model, its measures and relationships. Its rows become a variable named after the step (
rows,plants), which C# steps use; date-times reach them to the millisecond. - SQL
- DuckDB over the project’s sources and the model’s tables.
- C#
- Code with OpenBI’s library: tables, LightGBM, metrics, charts, models; OR-Tools, QuantLib and Open Graph in the analytics views.
- TikZ
- A figure as papers draw them (TikZ, pgfplots, circuitikz and others), compiled on this computer. Its name is its caption in the paper.
Each step’s header has its number, its kind, its name, its state (“changed since it ran”, “out of date: a step it uses changed”), its run time, and buttons to run it, move it and remove it. Edits are saved by themselves as you type.
Run
- Run all runs every step in order, and stops at the first that fails.
- In a step, Ctrl+Enter runs it, Shift+Enter runs it and moves to the next (on a Mac, ⌘+Enter). Ctrl+Shift+F formats an OAX step.
- Interrupt stops the running step. Restart kernel starts afresh, with every variable gone.
- On the right, Variables lists what the steps made, with their type and a line about each.
The steps run in a kernel, a process of its own that the studio starts with the first step. If it fails, only the kernel stops, never the studio.
Parameters
An OAX step can take parameters, written in its parameters box as asOf = 2025-06-30, min = 5 and used in the query as @asOf and @min. C# steps can run it again at other values: what was known about each customer at each date, for example, so a prediction learns only from the past.
What a step shows
Under each step: its tables (the first rows), text, charts, metrics side by side, a verdict, a plan, routes on a map, a network, a TikZ figure, or any report visual, drawn by C# as Visual.Chart(…) or Visual.Of("obi-…", …). A visual is kept as a picture, so the notebook, its PDF and Jupyter show the same; double-click it to use it live. Pictures enlarge into a window of their own.
The notebook’s tabs
- Notebook
- The steps.
- Flow
- The steps as a diagram drawn from the code: each step a box, each variable an arrow from the step that makes it to those that use it.
- Versions
- What the notebook saved: models, plans, valuations or networks, each a version a person approves before it is used (see Prediction).
- Their own
- A plan has Model and Scenarios (and Routes for routes), a valuation Run and Market data, a network Graph: see Operations research, Quantitative, Networks.
These versions are the notebook’s own. The project’s Versions view shows the notebook’s files changing, as for any file (see Versions).
Paper
Paper typesets the notebook as a paper beside it, a PDF: its title, numbered sections, figures and tables, and its code in an appendix. It is typeset again a moment after a step runs or its text changes, on this computer, with Typst.
Every typeset is checked: blank pages, text past the margins, tables too wide, rows set over each other, charts that zig-zag, numbers written two ways. The line above the paper says “checked: nothing wrong”, or what to put right, and what it put right by itself. Save the PDF… saves it; Detach puts the paper in a window of its own.
The library
C# steps use OpenBI’s notebook library. In short:
- Data
Table: tables that never change, withWhere,OrderBy,Joinand the rest; dates.- Learning
LightGbm,Metrics,Verdict, leakage checks, calibration, drift, walk-forward backtests, bootstrap intervals, survival (Cox), experiments, uplift, forecasts.- Deciding and valuing
OptimizeandRouting(OR-Tools);Quant,Curve,Market,Valuation, credit, XVA, margin, Monte Carlo (QuantLib);Network(Open Graph).- Saving and drawing
Models.SaveandResults.Savesave a version;Chart(with SHAP, loss curves, survival curves) andVisualdraw.
Autocomplete in a C# step lists the library’s types and members, the variables and the other steps. Every type and member is in the library reference.