Your first model
In about ten minutes, on the example project that ships with OpenBI Studio: you load a small file of sales targets, relate it to the products, write two measures, put them on a report page and save it all as a version.
You need OpenBI Studio installed (Install OpenBI Studio). The steps are the same on Windows and on a Mac; where a Mac differs, the step says so.
1. Open the example
Choose File › Open the example project. The studio copies Example Brewery to Documents\OpenBI\Example Brewery as a project of your own and opens it on its report pages. It is a made-up brewery: four products, three plants, fifteen shops in Oslo and three years of monthly sales.
Look around for a minute: the views down the left (Report, Tables, Model, OAX and the others), and the page tabs at the bottom of the Report view.
2. Get data from a file
The brewery has a target for each product. Make that file: open Notepad (on a Mac, TextEdit in plain-text mode), paste these lines and save them as Targets.csv in the project’s folder, Documents\OpenBI\Example Brewery:
Product,Target liters
Pils,1000000
IPA,350000
Cider,280000
Lettøl,180000- On the Home tab, in the Data group, choose Text / CSV. The Get data window opens on its Connect page.
- Under File, choose Browse…, pick
Targets.csv, then Next. - The Navigator shows the table Targets with its two columns and four rows. Choose Load.
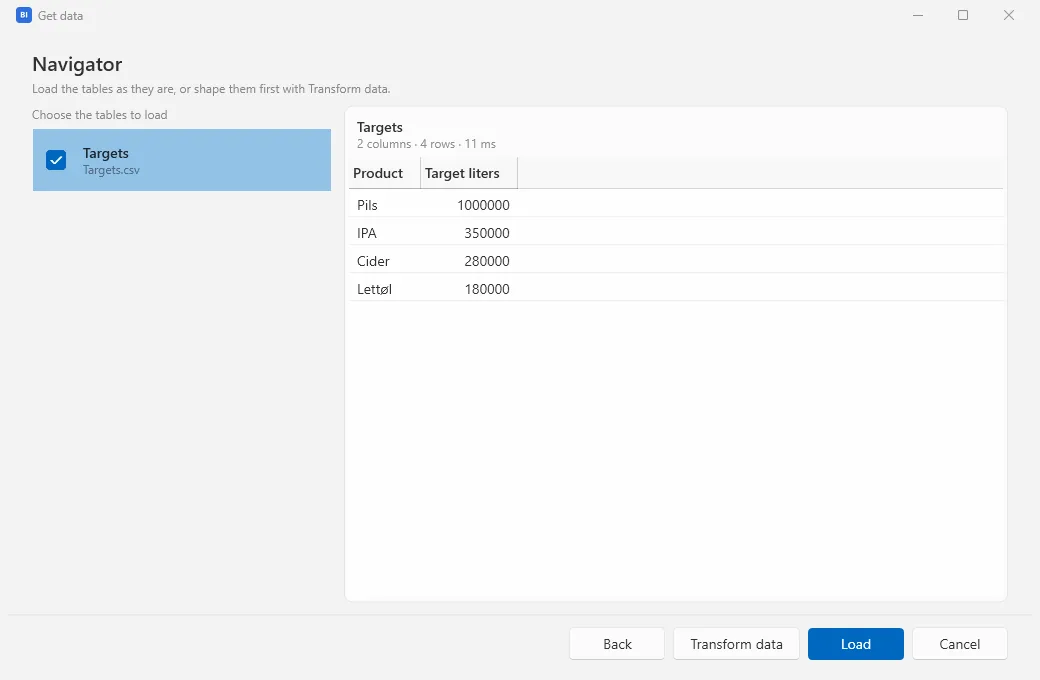
The table is now in the model, and its query is saved with the project, in M (the language of Open Query, OpenBI’s query editor, compatible with Power Query’s). Because the file is inside the project’s folder, the query names it by the project (${PROJECT_DIR}/Targets.csv), so it still works when you move or share the project.
3. Relate it to the products
- Choose Model on the left. The diagram shows every table; Targets is the new card.
- Drag Product in the Targets card onto Product in the Products card. The New relationship form opens on the right, filled in: From (the many side)
Targets[Product], To (the one side)Products[Product]. - Leave Active ticked and Cross filter at Single, and choose Add.
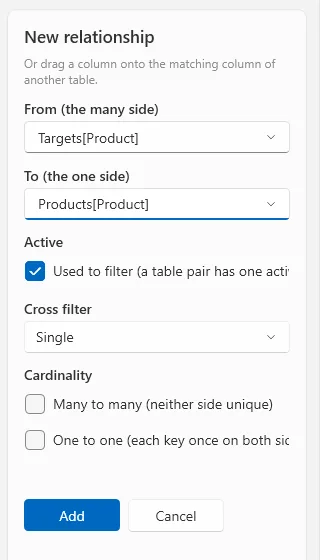
Instead of dragging, you can choose Relationship above the diagram and pick the two columns yourself.
4. Write two measures
- Choose Tables on the left, then Targets in the list. A new measure goes in the table shown.
- On the Home tab, choose New measure. The formula bar opens above the view with
Measure =, and the ribbon shows the Measure tools tab. - Replace it with the line below. As you type, the line under the formula bar shows the value over the whole model:
= 1810000. Press Enter to save it.Target = SUM ( Targets[Target liters] ) - On Measure tools, set Format to
#,0. - Choose New measure again and write the second one. Check Home table on Measure tools says Targets, press Enter, and set its Format to
0.0 %. Its value: 99.8 %.Liters vs target = DIVIDE ( [Liters sold], [Target] )
[Liters sold] is one of the example’s own measures, on the Sales table. Typing [ lists the measures and columns you can use. Esc puts the formula bar back to what is saved. Measures are written in OAX, OpenBI’s expression language, which is compatible with DAX (see Measures and OAX).
5. Make a report page
- Choose Report on the left, then New page on the Home tab (or + at the end of the page tabs). A blank page, Page 1, opens with Design on.
- In the Visuals pane, under Add a visual, choose the first icon, Column chart. A chart appears on the page, selected, and the pane shows its Fields.
- In the Data pane, open Products and drag Product onto Axis. Then drag Liters sold (in Sales) and Target (in Targets) onto Values.
- Click an empty part of the page, then drag Liters vs target onto it: a measure dropped on the page makes a card.
- Drag the visuals to move them, and their handles to size them. To rename the page, double-click its tab.
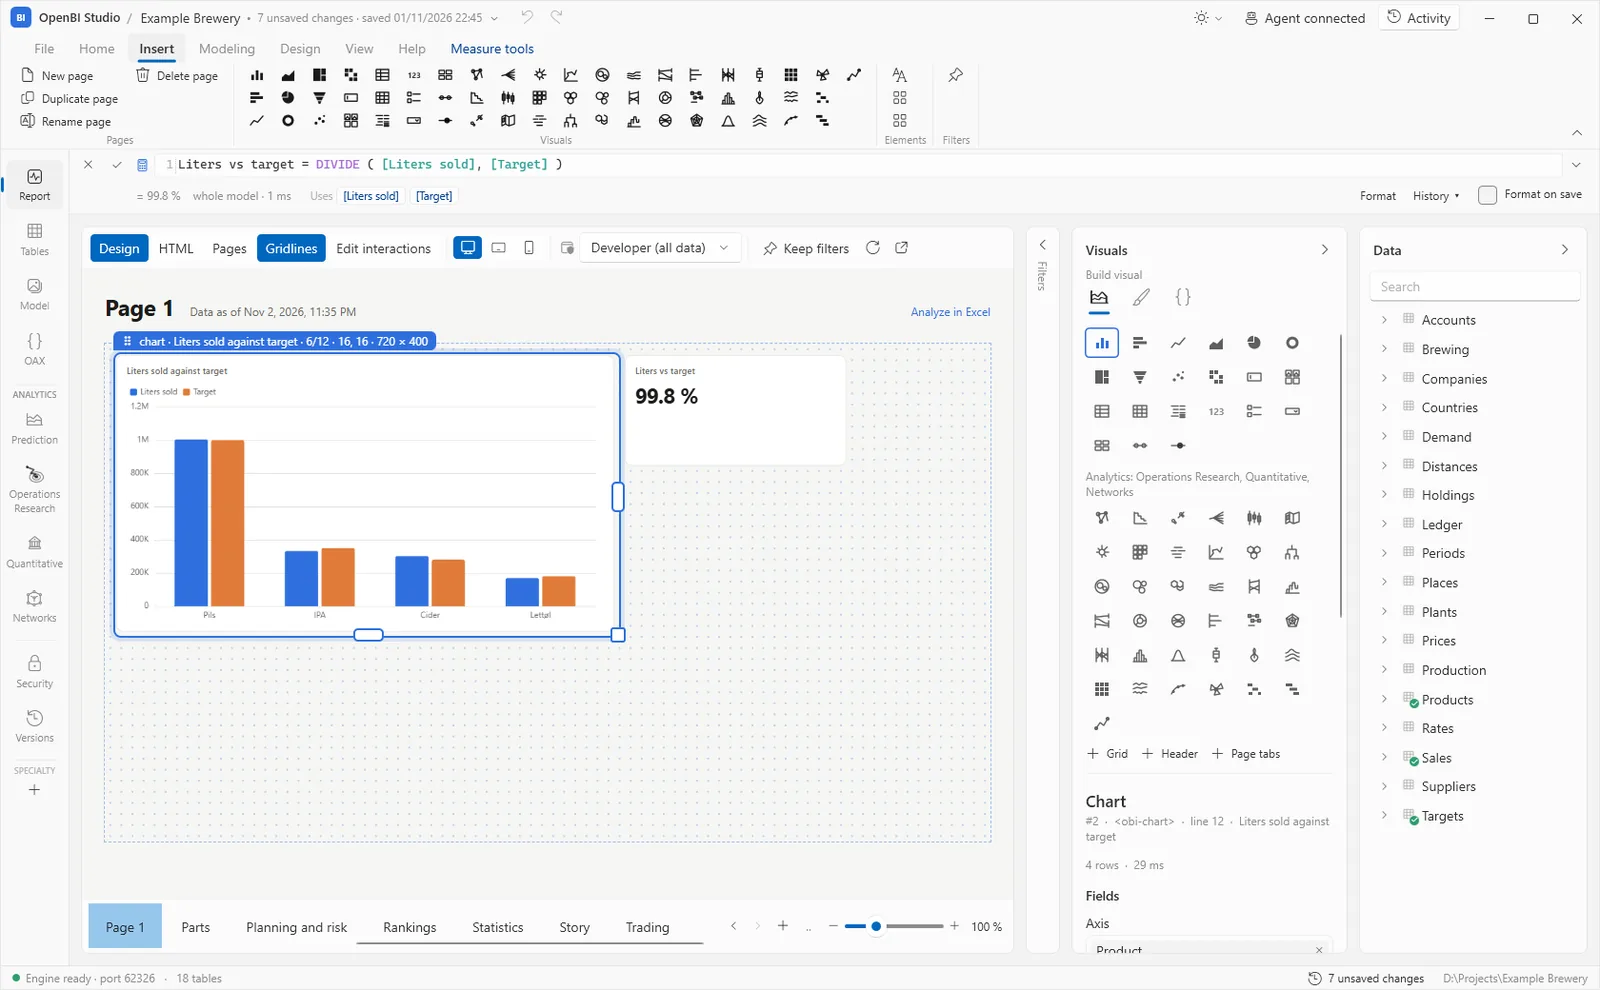
There is no Save button for pages: each change is written to the page’s file, reports\page-1.html, as you make it. Ctrl+Z undoes the last one.
6. Save a version
Your changes are on disk, but not yet a version you can go back to. Choose Save version on the Home tab (on a Mac, ⌘+S), or click the changes count at the bottom right.
The Save a version window lists what changed: the model’s files, the new table, the page and Targets.csv. Write what you did under Message, for example “Targets per product: a relationship, two measures and a page”, and choose Save version.
A version is a git commit of the project. Versions on the left shows each one with what it changed, and takes you back to any of them: see Versions.
Where next
- The studio at a glance: the views, the ribbon and where a project’s files are.
- Get data from your own sources: databases, Excel, the web, a lakehouse.
- Reports and Visuals: everything a page can show.