Charts and visuals
A step can draw three ways: a chart from the library, any of OpenBI’s report visuals on the model’s measures, or a TikZ figure. All of them show under the step, in the notebook’s paper, and in Jupyter.
Charts from the library
Chart.Bar, Chart.HBar and Chart.Line draw categories and series; a step’s last expression, or Display(…), shows them:
var sales = Dax("EVALUATE SUMMARIZECOLUMNS ( Products[Product], \"Liters 2024\", [Liters 2024], \"Liters 2025\", [Liters 2025] )");
var names = sales.Rows.Select(r => r.Text("Product")!).ToList();
Chart.Bar("Liters by product and year", names,
    new ChartSeries("2024", sales["Liters 2024"].ToNumbers()),
new ChartSeries("2025", sales["Liters 2025"].ToNumbers()))A chart is a ChartSpec, so with { … } changes it: a reference line (Reference), a marked category (Marker), the axes’ titles, the number format. The library also draws what analysis needs:
- Models
Chart.Loss(how a booster learned, and where it stopped),Chart.Shap,Chart.ShapDependence,Chart.ShapWaterfallandChart.Drivers,Chart.TenthsandChart.Reliability.- Time and outcomes
Chart.Survival,Chart.HistoryandChart.Forecast,Chart.Qini.- Distributions
- A simulation’s
Distribution.Chart()andSimulationResult.Fan(…).
Plans, routes, valuations and networks draw themselves under the step.
Report visuals
Visual.Of("obi-…", attributes) puts any of OpenBI’s report components under a step, on the model’s measures, as on a report page (see Visuals); Visual.Chart, Visual.Kpi and Visual.Matrix are short ways to the common ones, and Visual.Page shows a whole report page:
// a report visual on the model's measures, drawn by the studio under the step
Visual.Chart("column", "Products[Product]", "[Revenue]", title: "Revenue by product")
Revenue by product (a report visual: OpenBI Studio draws it)The studio draws it under the step and keeps a picture of it, so the notebook, its paper and Jupyter show the same; double-click it to use it live, with its filters and drill.
TikZ figures
A TikZ step is a figure as papers draw them: TikZ, pgfplots, circuitikz and the like, compiled on this computer. Its name is its caption in the paper, and the paper keeps it as a vector figure:
\begin{tikzpicture}[>=stealth]
  \draw[->] (0,0) -- (4.2,0) node[right] {liters};
  \draw[->] (0,0) -- (0,2.6) node[above] {margin};
  \draw[thick] (0,0) -- (1.5,1.6) -- (3,2.2) -- (4,2.3);
  \node[below] at (3,0) {plan};
  \draw[dashed] (3,0) -- (3,2.2);
\end{tikzpicture}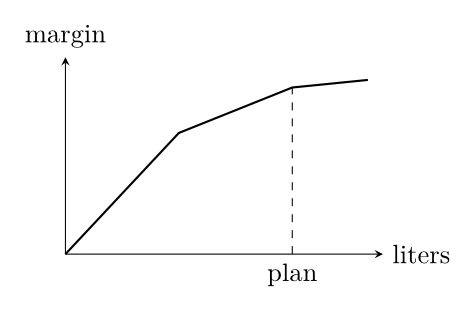
From C#, TikZ(code, title) draws one too. A TeX error shows at the step’s own line.
Every member is in the Charts and visuals reference.